. 2021 Feb 5;10:e64434. doi: 10.7554/eLife.64434

Figure 1. Generation of KCNQ2-DEE patient-specific iPSC-derived neurons.

(A) Illustration of proposed structure of KCNQ2 channel subunit containing the mutation R581Q at the C-terminus (red) and other variants associated with KCNQ2-epileptic encephalopathy reported in ClinVar and (Goto et al., 2019) (green). (B) Heterologous expression of KCNQ2-R581Q. Left: transfection strategy and voltage pulse step protocol. Middle: Average XE-991-sensitive whole-cell currents normalized by membrane capacitance recorded using automated patch-clamp. KCNQ3-expressing CHO-K1 cells were transiently transfected with wild-type KCNQ2 (15 µg) or R581Q variant (15 µg) to recapitulate a homozygous state (top) or with R581Q (10 µg) plus wild-type KCNQ2 (10 µg) or wild-type KCNQ2 (x2; 20 µg) to mimic the heterozygous state (bottom). Right: Summary data (mean ± SEM) for average current density measured at +30 mV expressed as % of KCNQ2 WT values (KCNQ2: n = 58, R581Q: n = 63; KCNQ2 (x2): n = 21, R581Q + KCNQ2: n = 22). R581Q alone or combined with wild-type KCNQ2 produced 81.6 ± 10.7% (t test: ***p<0.0001) and 56.6 ± 14.9% (t test: *p=0.006) smaller current density, respectively, as compared to cells expressing wild-type channels. (C) Illustration of iPSC-derived cortical excitatory neuron platform. (D) DNA sequence electropherograms of KCNQ2 in control and patient iPSCs before and after gene editing, demonstrate the correction of the heterozygous (R581Q; c.1742G>A) mutation (See Figure 1—figure supplements 2 and 3 and Supplementary files 13). (E) Immunocytochemical labeling of KCNQ2-DEE patient-derived (Q2-04R581Q/+) and isogenic control (isoQ2-04+/+) iPSC lines with the pluripotency markers NANOG, SSEA4, and DAPI merged. Scale bar: 100 µm. (F) Immunocytochemical labeling with glutamatergic and neuronal markers vGLUT1 and MAP2 and GFP. Scale bar: 50 µm. (G) Quantification of GFP fluorescence coincident with MAP2 and vGLUT1 immuno-positive staining in three unrelated healthy controls and patient and isogenic control iPSC-derived neurons (See Figure 1—figure supplement 4). (H) RT-qPCR expression analysis of KCNQ2 splice variants in the differentiated neuronal cultures on weeks 3 and 5 using isoform-specific primers (See Supplementary file 4). All values are normalized to fetal brain KCNQ2 splice variant 3, as it is the highest expressing variant in all samples. Data from human adult and fetal brain are shown for comparison.

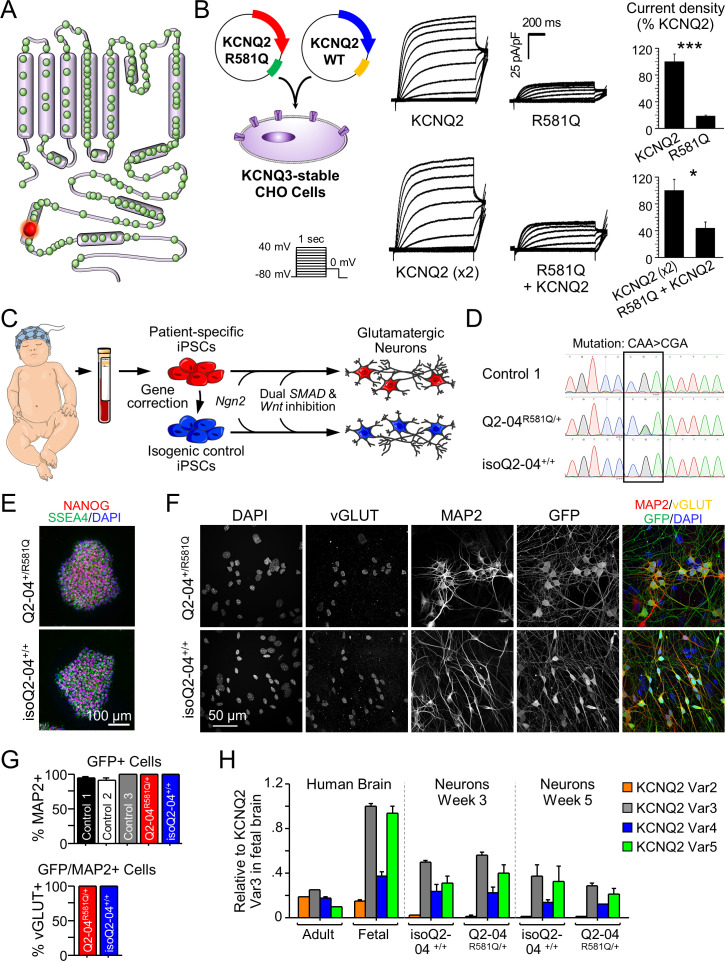
Figure 1—source data 1. Quantification of RT-qPCR expression ΔΔCt values of KCNQ2 splice variants for Figure 1H.

Figure 1.

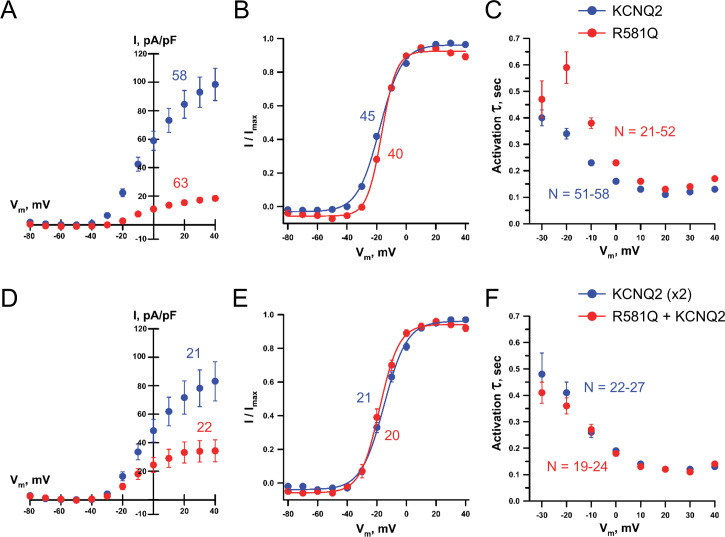
Figure 1—figure supplement 1. Whole-cell voltage-clamp analysis of KCNQ2 R581Q.

Figure 1—figure supplement 1.

Whole-cell currents were recorded using automated patch clamp from KCNQ3-stably expressing CHO-K1 cells transiently transfected with either. (A–C) wild-type KCNQ2 or R581Q in the homozygous KCNQ2 configuration or (D–F) co-transfected with R581Q and wild type KCNQ2 (heterozygous KCNQ2 configuration). (A,D) Average XE-991-sensitive whole-cell current-voltage relationship, (B,E) voltage-dependence of activation V½ and (C,F) time-constant of activation (τ). In the homozygous configuration, compared to wild type KCNQ2, R581Q exhibited a 1.31 ± 0.4 mV shift (t test: p=0.049) in the voltage-dependence of activation V½ (B) and a slower activation time constant in the −20 to +20 mV range (t test: p-values<0.0001; C). In the heterozygous configuration, compared to wild type KCNQ2 (x2), R581Q + KCNQ2 exhibited a −3.45 ± 1.22 mV shift (t test: p=0.043) in the voltage-dependence of activation V½ (E) with no difference in the activation time constant (F). Number of cells analyzed is displayed within the figure. Values displayed are mean ± SEM.
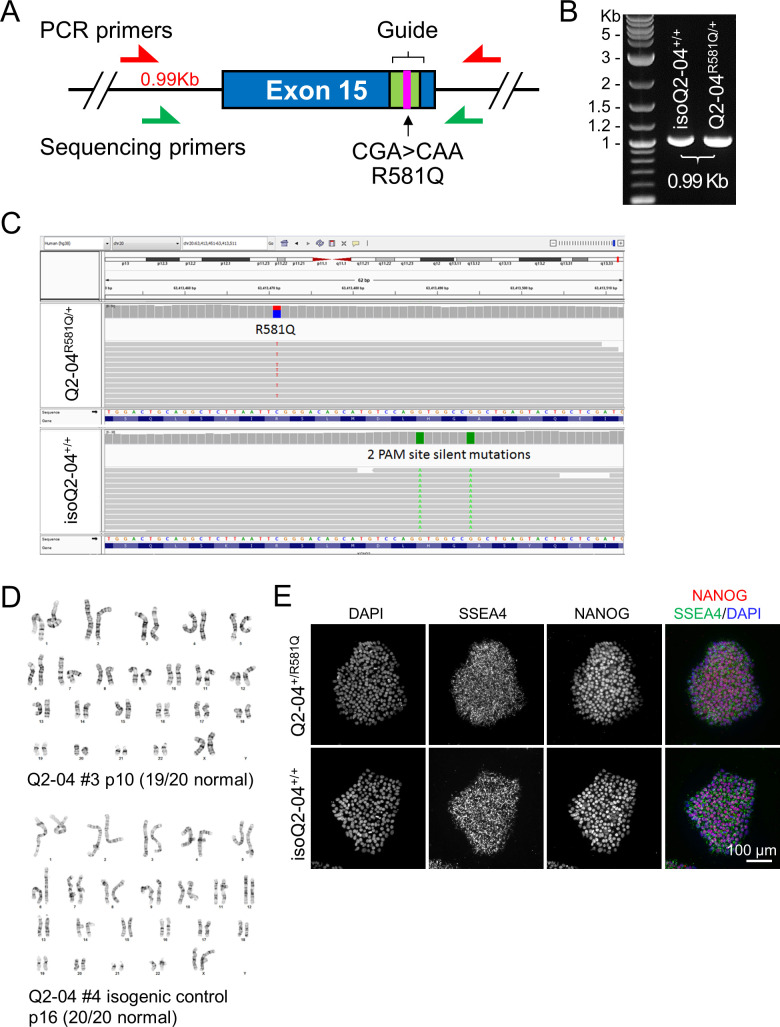
Figure 1—figure supplement 2. Quality control studies of iPSC lines.

Figure 1—figure supplement 2.

(A–B) Analysis of KCNQ2 targeted region after CRISPR/Cas9 gene correction. To validate the absence of large indels or mosaicism, a 0.99 Kb DNA fragment of genomic DNA around the targeted site was amplified and subjected to Sanger sequencing (Figure 1D). Products from both the parental and corrected iPSC lines exhibited one band of the expected size. (C) Karyotype analysis of patient and isogenic control iPSC lines. (E) Whole genome sequencing analysis of patient and isogenic control iPSCs. Integrated genomic viewer (IGV) showing 100 bp region around the patient mutation on exon 15 of KCNQ2 shows heterozygous R581Q mutation in the patient sample (top). Bottom: the mutation is corrected in the isogenic control sample. Also, two silent PAM site mutations were introduced in the isogenic control (in green). (G) Immunocytochemical labeling of Q2-04R581Q/+ and isogenic control (isoQ2-04+/+) iPSC lines with the pluripotency markers NANOG, SSEA4 and DAPI. Scale bar: 100 µm.
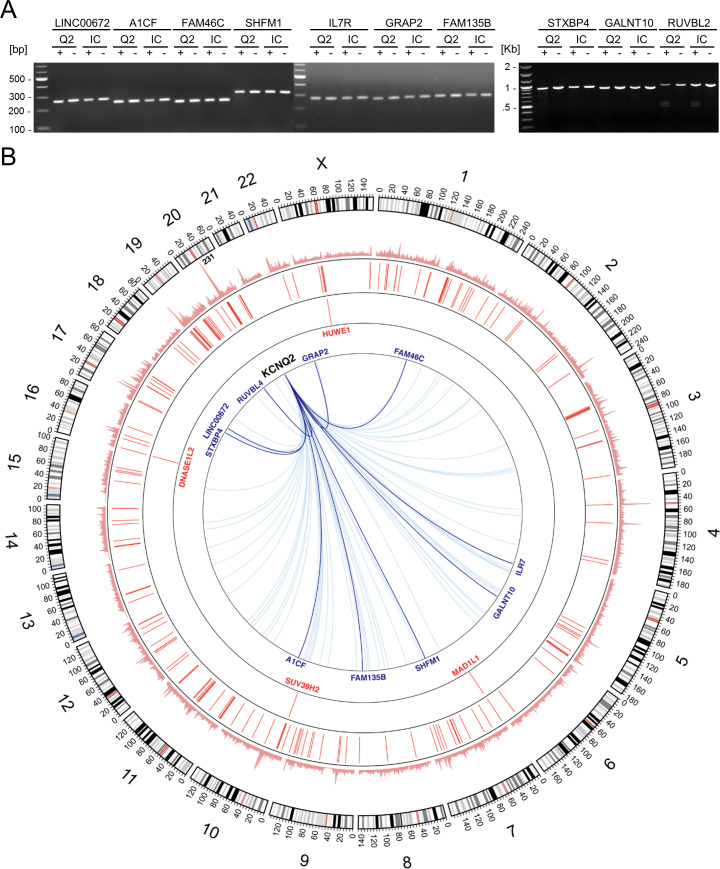
Figure 1—figure supplement 3. CRISPR off-target and whole genome sequencing analysis of iPSC lines.

Figure 1—figure supplement 3.

(A) Analysis of potential CRISPR off-target sites. The top ten genomic regions of homology with the CRISPR/Cas9 targeted region (Supplementary file 1) were analyzed by a T7 endonuclease assay (Supplementary file 2). No mutations were identified. (B) Whole-genome distribution of variant mismatches between the sequenced samples shown in Circos plot. WGS analysis identified 3,343,903 single nucleotide variants (SNVs) and small indels with at least one alternative allele in either of the two samples. Genotype mismatches were found for 50,736 variants (outer track), corresponding to the 1.57% of the total number of comparable positions across common and rare variants based on gnomAD (Genome Aggregation Database Consortium et al., 2020) or 0.002% across the entire genome (assuming 3 billion nucleotides). After annotation and functional prediction, we found 400 potentially deleterious variants, with 4 (1 SNV and three indels in genes labeled in red) being homozygous reference for Q2-04R581Q/+ and heterozygous for isoQ2-04+/+ and the rest 396 (223 SNVs and 173 indels) were heterozygous for isoQ2-04+/+ and homozygous reference for Q2-04R581Q/+ (second track; Supplementary file 3). Genotype comparison with in-house unrelated whole-genome sequenced samples showed that the four above-mentioned variants are only observed in the isoQ2-04+/+ sample and the other 396 are only seen in the Q2-04R581Q/+ sample, indicating that the four are likely to be newly introduced variations in the isogenic line and the 396 are likely to be sequencing artifacts. Genes overlapping the depicted potentially deleterious variants are shown in red and predicted CRISPR off-target sites are shown as blue lines (the top 10 in dark blue and the rest 63 in light blue).
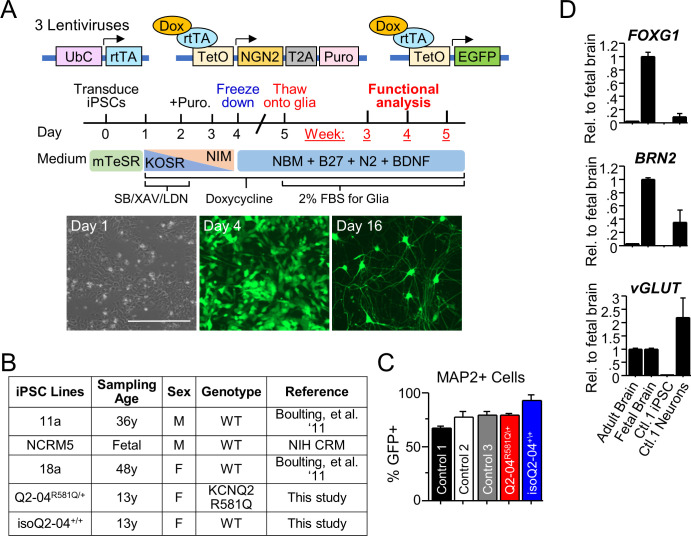
Figure 1—figure supplement 4. Quality control studies of iPSC-derived neurons.

Figure 1—figure supplement 4.

(A) Top: Design of lentiviral vectors for Ngn2-mediated conversion of iPSCs to cortical excitatory neurons through tetracycline-inducible expression of exogenous proteins driven by a tetracycline-inducible promoter (TetO). Cells are transduced with (i) a virus expressing reverse tetracycline-controlled transactivator (M2rtTA) driven by the ubiquitin promoter, (ii) a virus expressing Ngn2 linked by T2A to a puromycin (puro) resistance gene driven by TetO, and (iii) EGFP driven by the TetO promoter. Middle: Protocol for generation of cortical excitatory neurons (See Materials and methods). Bottom: Representative images illustrating the time course of the conversion of iPSCs into neurons. Corresponding bright field and GFP fluorescence images on day 1 before addition of doxycycline, day 4 before cryopreservation, and day 16 after thawing onto a mouse glia monolayer (day 5). This protocol is modified from Zhang et al., 2013. Scale bar: 400 µm. (B) Table of iPSC lines used in this study. (C) Quantification of MAP2 immuno-positive staining with MAP2 antibody coincident with GFP fluorescence in iPSC-derived neurons. More than 65% of the MAP2-positive neurons were also positive for GFP in all iPSC lines as quantified by fluorescent microscopy (Figure 1C). (D) RNA expression analysis using quantitative RT-PCR of vGLUT2, FOXG1, and BRN2 that are characteristic of excitatory layer 2/3 cortical neurons in healthy control iPSC-derived neurons at week 4. Human adult and fetal brain were used for comparisons.