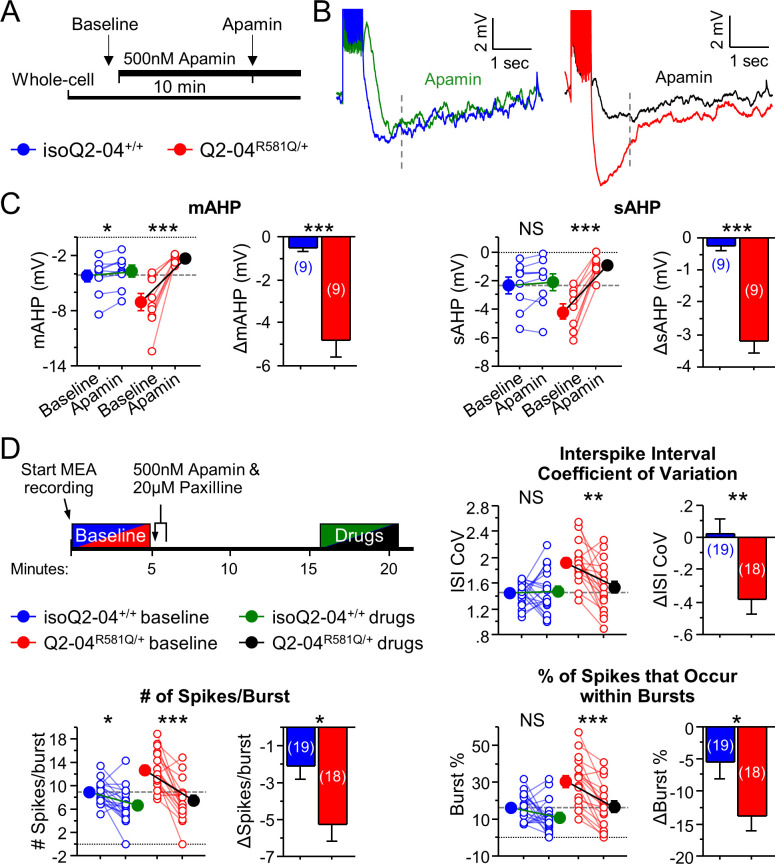
Figure 5. KCNQ2-DEE neurons exhibit a dyshomeostatic increase in SK and BK channel function.
(A) Experimental protocol. Baseline measures were made after establishing the whole-cell configuration in current-clamp mode. After exactly 10 min of continuous perfusion of 500 nM apamin in aCSF, the AP properties and post-burst AHP were measured. (B) Representative traces showing post-burst AHPs before and after apamin application. (C) Acute application of apamin significantly reduced mAHP (***p=0.0004) and sAHP (***p<0.0001) in Q2-04R581Q/+ neurons and reduced mAHP in isogenic control neurons (mAHP: *p=0.0114) but not sAHP (sAHP p=0.132). However, the magnitude by which apamin reduced both mAHP and sAHP was significantly larger in Q2-04R581Q/+ neurons (t-test: ***p=0.0001, ***p<0.0001, respectively). (D) Right: Experimental protocol. Apamin (500 nM) and paxilline (20 µM) were added to MEAs after 5 min of baseline spontaneous recordings. The effect of drugs was measured after 10 min of continuous recording for 5 min. These K+ channel inhibitors reduced ISI CoV (**p=0.0015), spikes/burst (***p<0.0001) and % of all spikes that occur in bursts (***p<0.0001) in Q2-04R581Q/+ neurons. The number of spikes per burst were reduced in isoQ2-04+/+ neurons (*p=0.0051) but ISI CoV and burst % were not changed (p=0.796, p=0.0687, respectively). The magnitude by which apamin and paxilline reduced ISI CoV, spikes/burst and burst % was significantly larger in Q2-04R581Q/+ neurons (t-test: **p=0.0048, *p=0.0087 and *p=0.0254, respectively). Repeated measures ANOVA was used to compare drug effects and posthoc t-tests were used where the interaction of before/after drug and genotype was significant. A dotted line is drawn through the mean baseline values measured for isoQ2-04+/+ neurons before acute application of apamin and paxilline. Number of neurons analyzed is displayed within the figure; values displayed are mean ± SEM.

