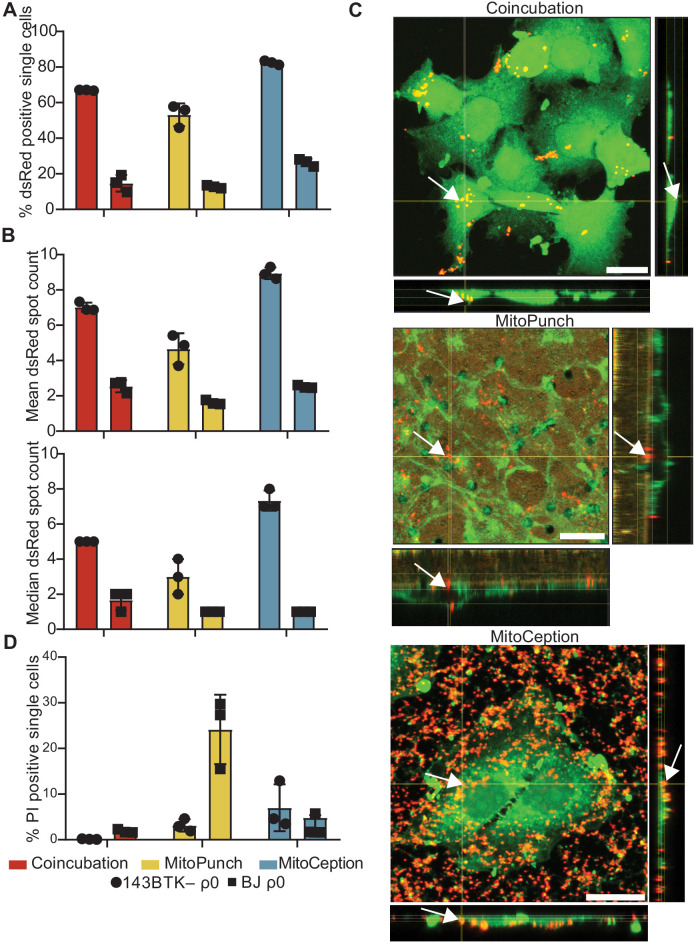
Figure 2. MitoPunch delivers isolated mitochondria to recipient cells.
(A) Quantification of flow cytometry results measuring the association of dsRed mitochondria with 143BTK– ρ0 and BJ ρ0 single recipient cells following mitochondrial transfer. (B) Mean and median dsRed spot count quantification of ImageStream data. (C) Sequential Z-stacks of confocal microscopy of 143BTK– ρ0 cells delivered isolated HEK293T-derived dsRed mitochondria by coincubation, MitoPunch, and MitoCeption and fixed 15 min following transfer. Arrows indicate representative mitochondria interacting with recipient cells. Transferred dsRed mitochondria are labeled in red. Plasma membranes are labeled in green, stained with CellMask Green plasma membrane stain in coincubation and MitoCeption and with wheat germ agglutinin plasma membrane stain in MitoPunch. Scale bars indicate 15 µm. (D) Quantification of flow cytometry measurements of fluorescence in 143BTK– ρ0 and BJ ρ0 single cells following propidium iodide transfer by coincubation, MitoPunch, and MitoCeption. Error bars represent SD of three technical replicates in all figures.


