. 2021 Jan 22;10:e62117. doi: 10.7554/eLife.62117

Figure 2. Mfd-elongation complex (EC) structures.

(A) The structure of apo-Mfd [PDB 2EYQ; Deaconescu et al., 2006] is shown as a transparent molecular surface surrounding a backbone ribbon. The domain nomenclature and color coding are schematically represented by the horizontal bar below, which represents the 1148-residue Eco Mfd primary sequence (every 100 residues are marked by a vertical white line). Structural domains are shown as thick bars; thin bars represent connecting linkers. The UvrB homology module (D1a-D2-D1b) is structurally homologous to the namesake elements of UvrB (Deaconescu et al., 2006; Selby and Sancar, 1993). D4 is the RNA polymerase (RNAP) interacting domain (RID). D5 (Translocation Domain 1, or TD1) and D6 (TD2) contain the seven SF2 ATPase motifs denoted by white boxes and labeled (Gorbalenya and Koonin, 1993) as well as the TRG motif (Chambers et al., 2003; Mahdi et al., 2003), and together comprise the translocation module. (B)–(H). (Top) Overall structures of Mfd-EC complexes obtained by cryo-EM. The cryo-EM density maps low-pass filtered to the local resolution (Cardone et al., 2013) are shown as transparent surfaces with final models superimposed. Mfd is colored as shown in (A); the RNAP and nucleic acids are colored according to the key. (Bottom) Cryo-EM density (blue mesh) and superimposed models in the region around the Mfd nucleotide-binding site. Bound nucleotide could not be visualized in the L1 cryo-EM map (B) because of the low resolution. The nucleotide status (either ADP or ATP/ATP•P) could be determined from the cryo-EM map alone for C1(ATP), C2(ATP), C4(ADP), and C5(ATP) (see Supplementary file 2). Determination of the nucleotide status for L2(adp) and C3(adp) was not possible from the cryo-EM maps alone (see Supplementary file 2), but other arguments suggest that these two states were bound to ADP (see text). (B) L1. (C) L2(adp). (D) C1(ATP). (E) C2(ATP). (F) C3(adp). (G) C4(ADP). (H) C5(ATP).

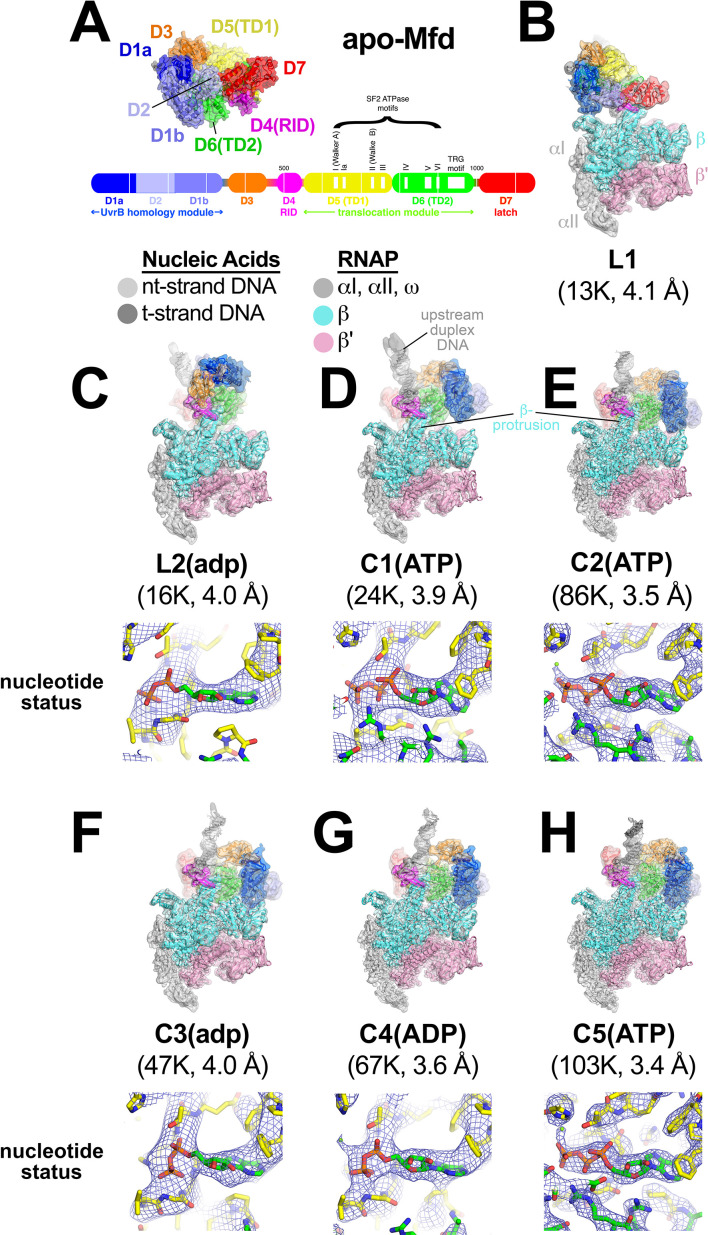
Figure 2.

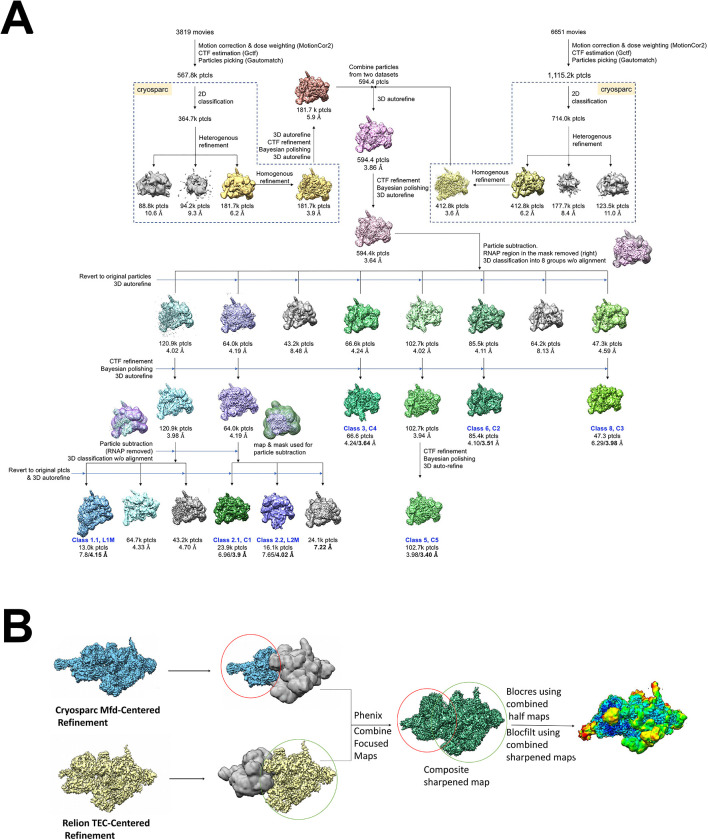
Figure 2—figure supplement 1. Cryo-EM processing pipeline for Mfd-elongation complex (EC) complexes.

Figure 2—figure supplement 1.

(A) Cryo-EM processing pipeline for Mfd-EC complexes. (B) EC-centered and Mfd-centered maps were combined using the PHENIX combine_focused maps command (Adams et al., 2010).
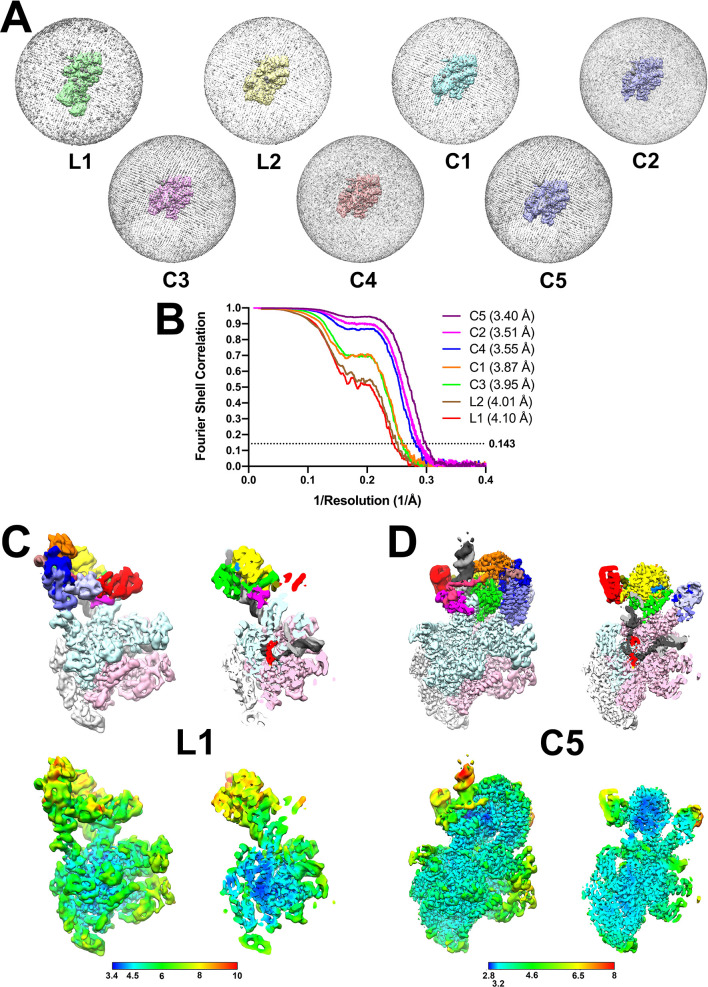
Figure 2—figure supplement 2. Cryo-EM of Mfd-elongation complex (EC) complexes.

Figure 2—figure supplement 2.

(A) Angular distribution of particle projections for each structural class. (B) Gold-standard FSC for the EC-centered/Mfd-centered composite maps, calculated by comparing the two independently determined half-maps using the MTRIAGE module (Afonine et al., 2018) of PHENIX (Adams et al., 2010). The dotted line represents the 0.143 FSC cutoff. (C and D) (Top) Views of the cryo-EM density map, colored according to the key of Figure 2. The right view is a cross-section through the center of the left view. (Bottom) Same views as on top but colored by local resolution (Cardone et al., 2013). C.L1, the lowest resolution structural class. D.C5, the highest resolution structural class.
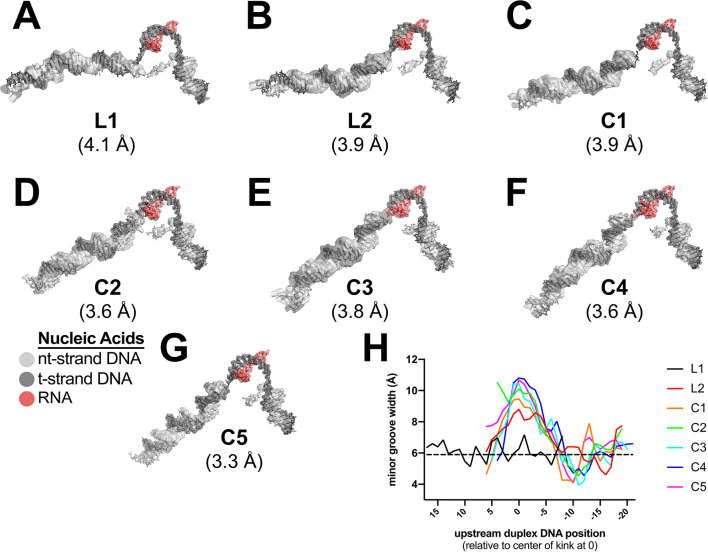
Figure 2—figure supplement 3. Examples of cryo-EM density and Mfd-induced DNA kink.

Figure 2—figure supplement 3.

(A)–(G). Cryo-EM density maps, filtered according to the local resolution (Cardone et al., 2013), corresponding to the nucleic acids, are shown as transparent surfaces with the final refined models superimposed. The color coding is shown in the key. (A) L1. (B) L2. (C) C1. (D) C2. (E) C3. (F) C4. (G) C5. (H) Plot showing the minor groove width [calculated using Curves+ (Lavery et al., 2009)] of the upstream duplex DNA, aligned by the center of the kink (defined as position '0').
Figure 2—video 1. The Mfd loading cycle.
Download video file (8.4MB, mp4)
The video starts with a top view of the elongation complex (EC). The upstream duplex DNA exits the complex in the ~11 o'clock direction. The direction of transcription would be left-to-right. The color coding of the RNA polymerase (RNAP) subunits is as in Figure 2; αI, αII, ω, light gray; β, light cyan; β', light pink. The t-strand DNA is colored dark gray, and the nt-strand DNA light gray. The video progresses through the Mfd loading pathway {[L0] → L1 → L2 → C1}. To begin, the apo-Mfd structure (color coded as in Figure 2A) enters from the upper-right and the Mfd-D4(RID) docks with the RNAP βprotursion and the upstream duplex DNA to generate [L0]. Through the progression of structures, the current structure shown in the video is highlighted in red (upper left). During the transition from L1 → L2, Mfd-D1-D3 are removed for clarity (as modeled in [L1.5a] and [L1.5b] in Figure 5), and the Mfd translocation module [D5(TD1)/D6(TD2)] translocates on the DNA, moving toward the RNAP until D6(TD2) encounters the RNAP βprotrusion. The L2 → C1 transition mainly involves repositioning of Mfd-D1-D3, finally exposing the UvrA-interacting surface of Mfd-D2.