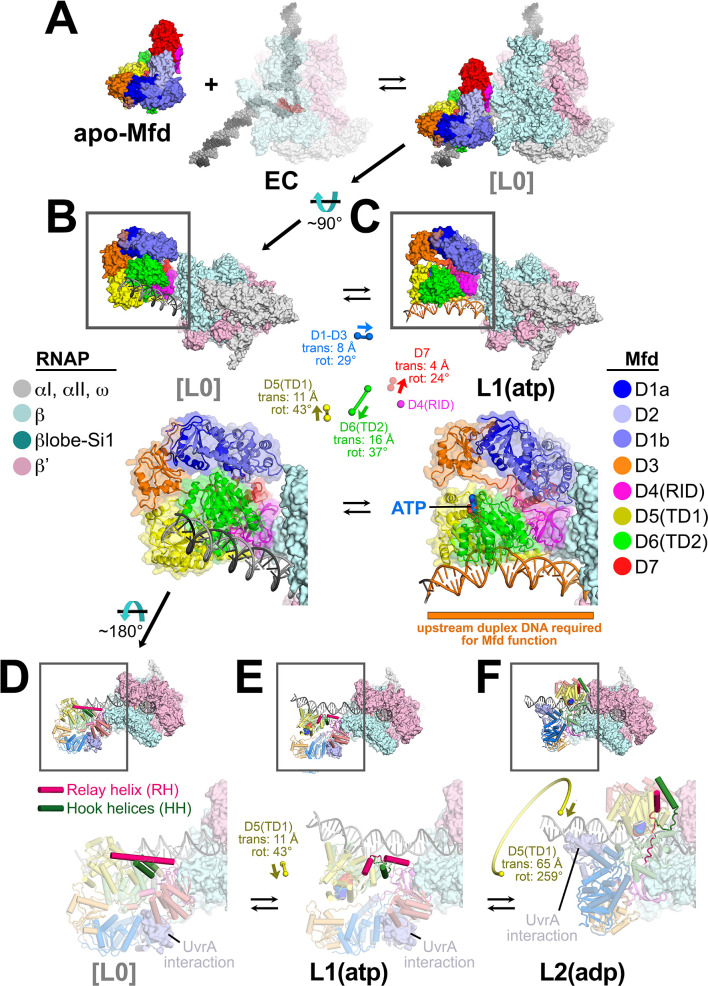
Figure 4. Initial stages of the Mfd loading pathway.
Color coding of RNA polymerase (RNAP) subunits and Mfd domains are shown in the keys on the left and right, respectively. (A) Apo-Mfd PDB 2EYQ (Deaconescu et al., 2006) combines with an elongation complex (EC) [PDB 6ALF (Kang et al., 2017) with upstream and downstream duplex DNA extended] to form a putative initial encounter complex [L0], which was modeled by superimposing apo-Mfd D4(RID) onto the MfdL1-D4(RID) and adjusting the trajectory of the upstream duplex DNA. (C) The [L0] → L1(atp) transition is shown. In this view, the downstream duplex DNA (and the direction of transcription) points away from the viewer. (Top) The Mfd-EC structures are shown as molecular surfaces with DNA shown in cartoon format. The boxed regions are magnified below. (Bottom) Mfd is shown as a transparent molecular surface surrounding a backbone ribbon. In the middle, the colored spheres denote the relative positions of the Mfd domain center-of-masses (com), with connecting lines denoting the motions from the L[0] → L1(atp) transition (the translations of the com's, as well as the relative rotation of the domains, are listed. The D4(RID) motion is negligible; also see Supplementary file 4). D.[L0]. E.L1(atp): The region of the upstream duplex DNA colored orange and denoted by the orange stripe was found to be required for Mfd function on an EC (Park et al., 2002). (F) View of the [L0] → L1(atp) → L2(adp) transition, highlighting the structural changes in the Mfd relay helix (RH) and hook helices (HH). In this view, the Mfd-EC complex is rotated ~180° about a horizontal axis, so the downstream duplex DNA (and direction of transcription) is toward the viewer. (Top) The RNAP is shown as a molecular surface, with nucleic acids shown in cartoon format. Mfd is shown with cylindrical helices. Color coding is as above but the RH is colored hot pink, and the HHs are colored dark green. The boxed region is magnified below. (Bottom) The complexes are shown in faded colors except for the RH and HHs. Also shown as a molecular surface are the residues of Mfd-D2 that interact with UvrA [determined from PDB 4DFC (Deaconescu et al., 2012)]. D.L[0]: The RH at the very N-terminus of TD1 extends for 30 residues and is surrounded by the HHs at the very C-terminus of TD2. The UvrA-interacting surface of Mfd-D2 is occluded by D7 (Deaconescu et al., 2006). E.L1(atp): The middle portion of the RH helix unfolds and the RH kinks about 112° around the second HH due to the translation/rotation of TD1 (denoted) and also TD2. The UvrA-interacting surface of Mfd-D2 is still occluded by D7. F.L2(adp): The transition from L1(atp) → L2(adp) involves a 259° rotation of TD1 around the backside of the DNA, as well as a 65 Å translation toward the RNAP (denoted). This is likely accomplished by ATP-hydrolysis-dependent walking of the Mfd translocation module and D7 along the DNA until it bumps into the RNAP. The corkscrewing translocation module unfolds the N-terminal half of the RH, wrapping it around the DNA as it goes. In this process D2 is separated from D7 but the UvrA-interacting surface of D2 is now occluded by the DNA. Also see Figure 2—video 1.


