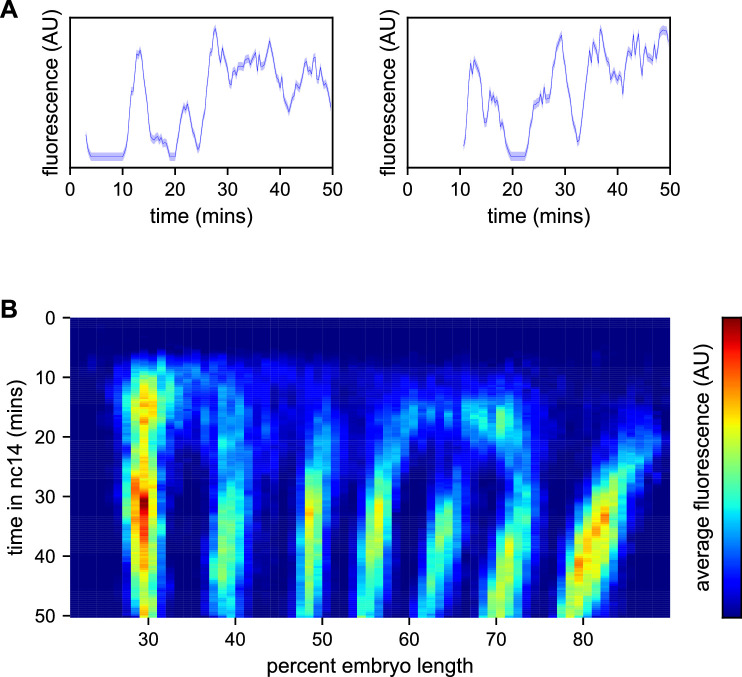
Figure 3. Spatiotemporal dynamics of even-skipped expression.
(A) Fluorescence traces from two representative nuclei (particle ID = 1.0163 and 11.0448). (B) Average fluorescence over space and time showing stripe formation, modulation and movement. The time resolution along the y-axis is 20 s. The positions of nuclei along the x-axis were registered across movies based on the inferred position of stripe centers, and placed into bins of 1% embryo length, with the average fluorescence of all nuclei in each bin plotted. (A, shading corresponds to the error estimated based on the background fluorescence fluctuations as described in Garcia et al., 2013).

