. 2021 Feb 5;10:e59067. doi: 10.7554/eLife.59067

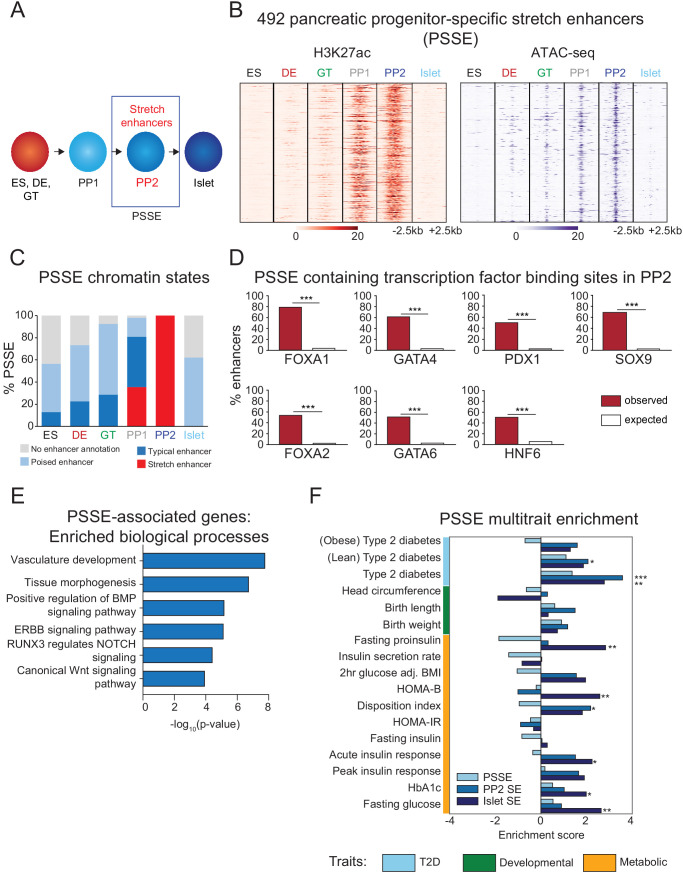
Figure 2. Candidate target genes of pancreatic progenitor-specific stretch enhancers regulate developmental processes.

(A) Schematic illustrating identification of pancreatic progenitor-specific stretch enhancers (PSSE). (B) Heatmap showing density of H3K27ac ChIP-seq and ATAC-seq reads at PSSE, centered on overlapping H3K27ac and ATAC-seq peaks, respectively, and spanning 5 kb in ES, DE, GT, PP1, PP2, and islets. PSSE coordinates in Figure 2—source data 1. (C) Percentage of PSSE exhibiting indicated chromatin states at defined developmental stages and in islets. (D) Percentage of PSSE overlapping with at least one ChIP-seq peak at PP2 for the indicated transcription factors. Enrichment analysis comparing observed and expected overlap based on random genomic regions of the same size and located on the same chromosome averaged over 10,000 iterations (***p<1×10⁻⁴; permutation test). (E) Gene ontology analysis for nearest expressed genes (fragments per kilobase per million fragments mapped (FPKM) ≥1 at PP2) to the 492 PSSE. See also Figure 2—source data 2. (F) Enrichment (LD score regression coefficient z-scores) of T2D, developmental, and metabolic GWAS trait-associated variants at accessible chromatin sites in PSSE as compared with PP2 and islet stretch enhancers. Significant enrichment was identified within accessible chromatin at PP2 stretch enhancers for lean type 2 diabetes (Z = 2.06, *p=3.94 × 10−2), at PP2 stretch enhancers for type 2 diabetes (Z = 3.57, ***p=3.52 × 10−4), at islet stretch enhancers for type 2 diabetes (Z = 2.78, **p=5.46 × 10−3), at islet stretch enhancers for fasting proinsulin levels (Z = 2.83, **p=4.61 × 10−3), at islet stretch enhancers for HOMA-B (Z = 2.58, **p=9.85 × 10−3), at PP2 stretch enhancers for disposition index (Z = 2.18, *p=2.94 × 10−2), at islet stretch enhancers for acute insulin response (Z = 2.24, *p=2.51 × 10−2), at islet stretch enhancers for HbA1c (Z = 1.98, *p=4.72 × 10−2), and at islet stretch enhancers for fasting glucose levels (Z = 2.64, **p=8.31 × 10−3). See also Figure 2—source data 3 and Figure 2—figure supplement 1.

Figure 2—source data 1. Chromosomal coordinates of pancreatic progenitor-specific stretch enhancers (PSSE).
Figure 2—source data 2. Enriched gene ontology terms for PSSE-associated genes.
Figure 2—source data 3. Proportion of variants nominally associated with beta cell functional traits.
Figure 2—source data 4. Tissue identity of downloaded data from ROADMAP consortium.

Figure 2.

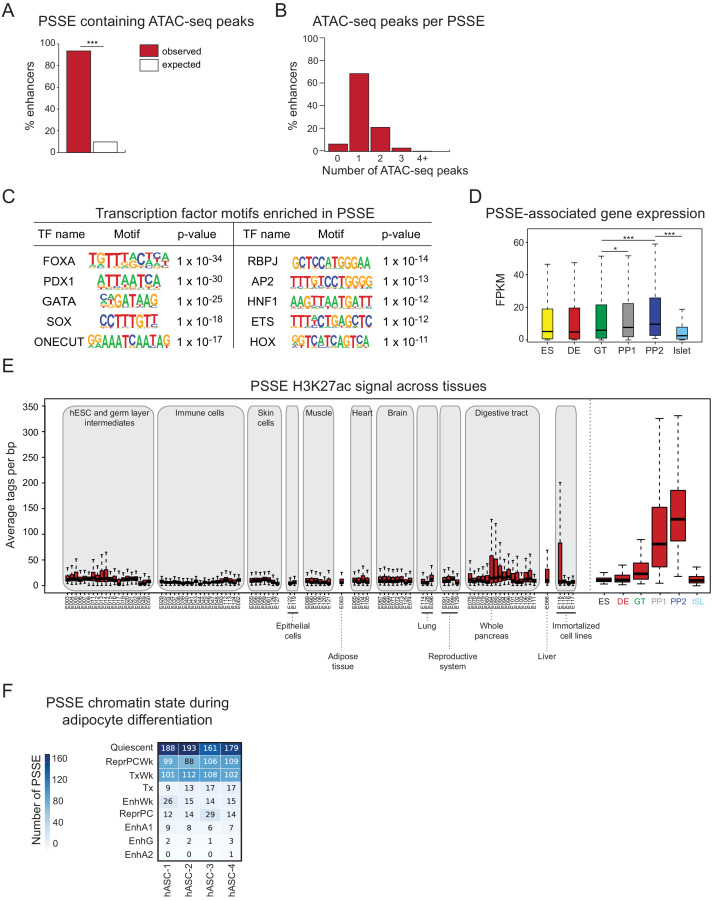
Figure 2—figure supplement 1. Characterization of pancreatic progenitor-specific stretch enhancers.

Figure 2—figure supplement 1.

(A) Percentage of PSSE overlapping with at least one ATAC-seq peak at PP2. Enrichment analysis comparing observed and expected overlap based on random genomic regions of the same size and located on the same chromosome averaged over 10,000 iterations (***p<1 × 10−4; permutation test). (B) Percentage of PSSE overlapping 0, 1, 2, 3, or 4+ ATAC-seq peaks at PP2. (C) Enriched transcription factor (TF) binding motifs with associated p-values at ATAC-seq peaks at PP2 intersecting PSSE. Fisher’s exact test, two sided, corrected for multiple comparisons. (D) Box plots showing mRNA levels based on RNA-seq of nearest expressed genes (fragments per kilobase per million fragments mapped (FPKM) ≥1 at PP2) for PSSE at each developmental stage and in islets (*p=1.10 × 10−2 for GT vs PP1; ***p=1.80 × 10−8 for GT vs PP2, p<2.2 × 10−16 for PP2 vs islet; Wilcoxon rank sum test, two sided). Plots are centered on median, with box encompassing 25-75th percentile and whiskers extending up to 1.5 interquartile range. n = 3 replicates from independent differentiations at ES, DE, GT, PP1, and PP2, respectively; n = 3 islet replicates. (E) Box plots showing H3K27ac signal at PSSE in tissues and cell lines from the ENCODE and Epigenome Roadmap projects as well as in developmental intermediates and islets (ISL). Plots are centered on median, with box encompassing 25-75th percentile and whiskers extending up to 1.5 interquartile range. See also Figure 2—source data 4. (F) Number of PSSE overlapping defined chromatin states in human adipose stromal cells from preadipose (hASC1) to mature adipose state (hASC4) (from Varshney et al., 2017). ChromHMM classifications: Quiescent; ReprPCWk, Weak Repressed PolyComb; TxWk, Weak Transcription; Tx, Strong Transcription; EnhWk, Weak Enhancer; ReprPC, Repressed Polycomb; EnhA1, Active Enhancer 1; EnhG, Genic Enhancer; EnhA2, Active Enhancer 2.