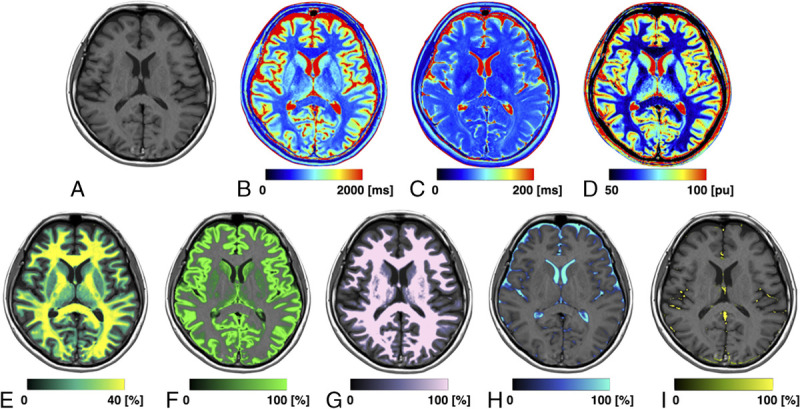
FIGURE 2.

Representative images of a 24-year-old patient. Panels show a synthetic T1-weighted image (A) and maps of T1 (B), T2 (C), PD (D), MVF (E), GM (F), WM (G), CSF (H), and NoN (I). MVF, GM, WM, CSF, and NoN maps are overlaid on a T1-weighted image.
