FIGURE 5.

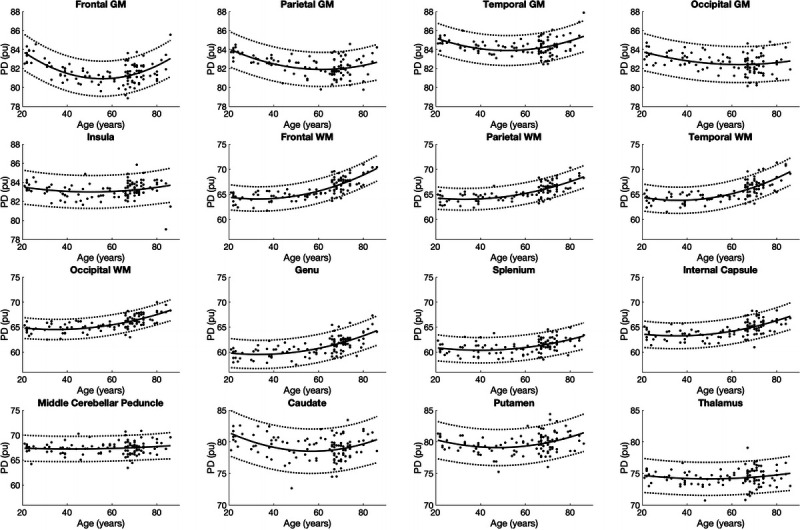
Scatterplots and approximate curves of PD in relation to age for each region. A regression line is shown with 95% confidence intervals (dotted lines).

Scatterplots and approximate curves of PD in relation to age for each region. A regression line is shown with 95% confidence intervals (dotted lines).