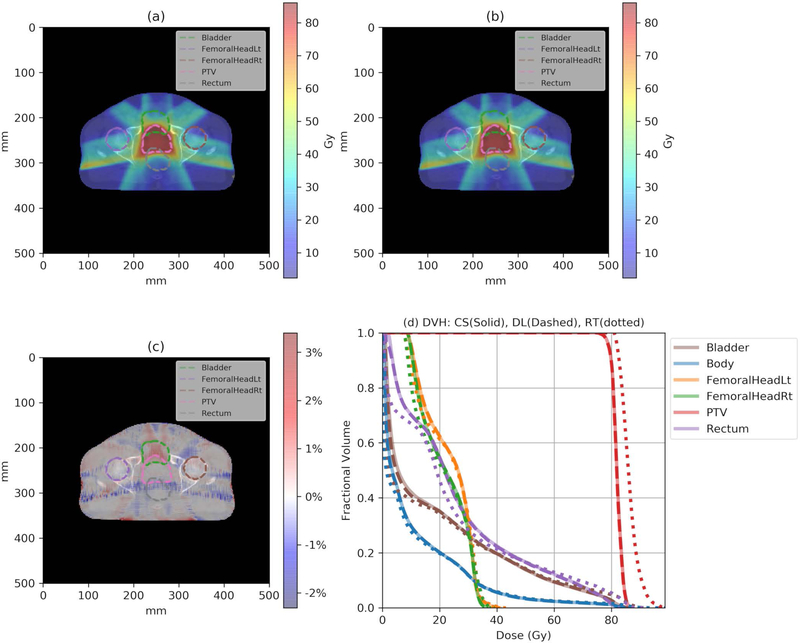
Figure 3.
(a) One slice of the CS dose distribution; (b) the corresponding slice of the DL dose distribution; (c) the relative dose difference () distribution; and (d) the DVH plots of the CS (solid), the DL (dashed), and the RT (dotted) doses for one example test patient. Note that CS and DL DVH curves completely overlap with each other.

