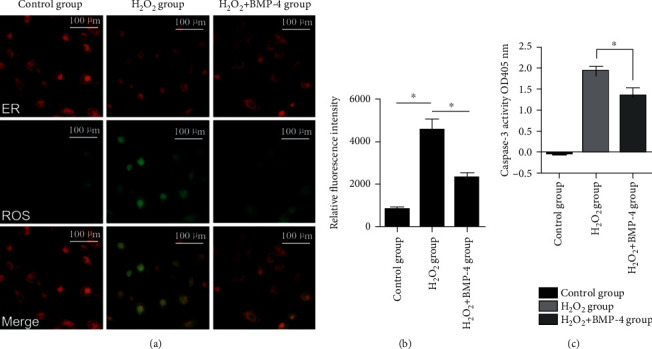
Figure 6.

(a) The production of cellular ROS detected by DCF fluorescence. The control group showed minimal ROS production; however, in the H2O2 group, the amount of ROS, which is indicated by green fluorescence, significantly increased. The green fluorescence was attenuated in the H2O2+BMP-4 group, and the relative fluorescence intensity was significantly reduced compared with that in the H2O2 group. (b) Fluorescence intensity quantification of ROS production (green channel). (c) Caspase-3 activity in HLE-B3.
