Figure 7.

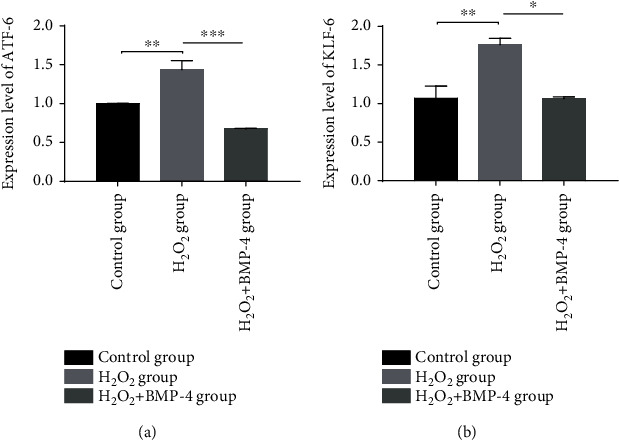
Effects of H2O2-induced oxidative stress on the expression of (a) ATF-6 and (b) KLF-6 in HLECSs. ∗ represents p < 0.05 vs. the H2O2 group, ∗∗ represents p < 0.01 vs. the H2O2 group, and ∗∗∗ represents p < 0.001 vs. the H2O2 group.

Effects of H2O2-induced oxidative stress on the expression of (a) ATF-6 and (b) KLF-6 in HLECSs. ∗ represents p < 0.05 vs. the H2O2 group, ∗∗ represents p < 0.01 vs. the H2O2 group, and ∗∗∗ represents p < 0.001 vs. the H2O2 group.