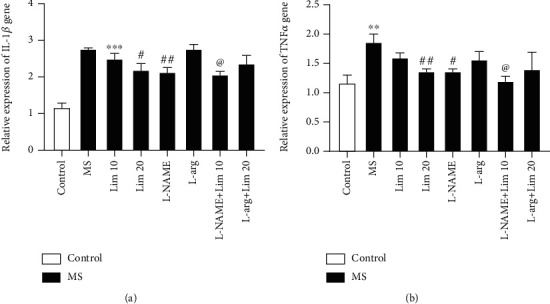
Figure 6.

The expression of inflammatory genes in the hippocampus. (a) Il-1β and (b) Tnf-α. Values are presented as the mean ± S.E.M. from 4 samples and were analyzed by one-way ANOVA followed by Tukey's post hoc test. ∗∗P < 0.01 and ∗∗∗P < 0.001 compared to the control group. #P < 0.05 and ##P < 0.01 compared to the MS group. @P < 0.05 compared to the group that received limonene (10 mg/kg). MS: maternal separation; Lim: limonene; L-arg: L-arginine.
