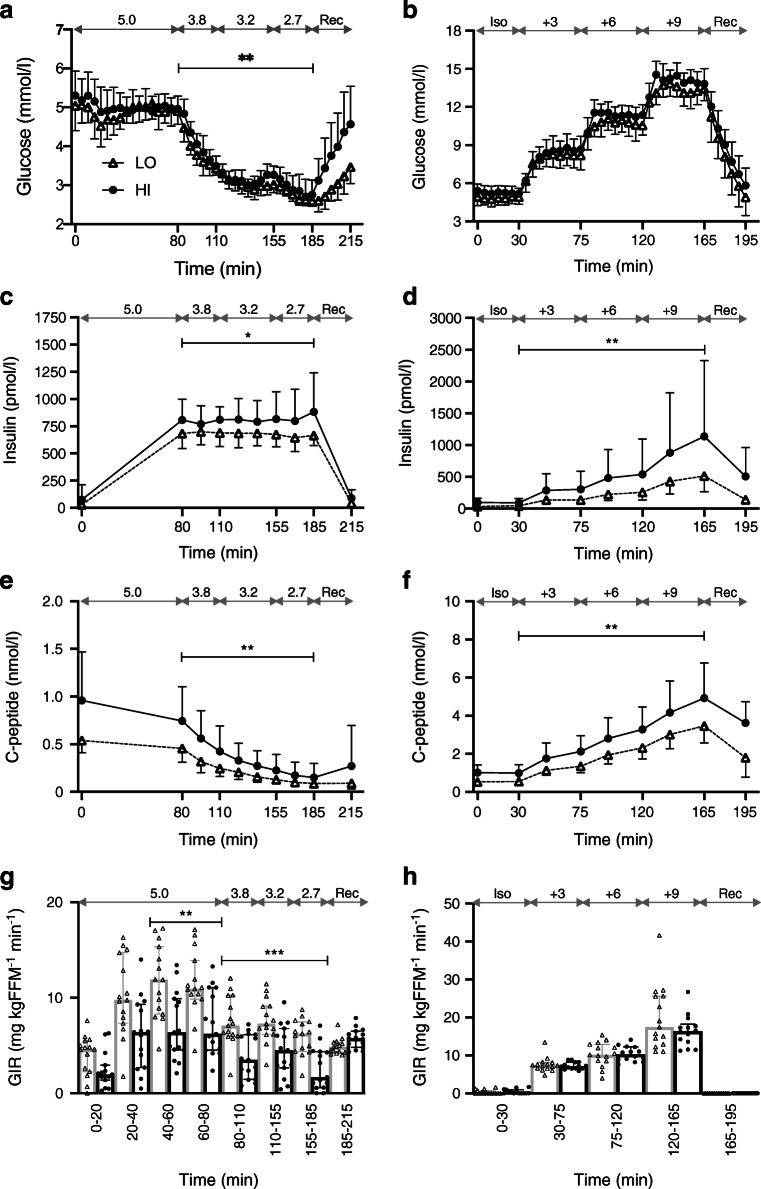
Fig. 2.
Levels of glucose measured by bedside glucometer (a, b), insulin (c, d), C-peptide (e, f) and GIR/FFM (g, h). Data are presented as geometric means ± geometric SD (a–f) and medians ± IQRs, as well as individual values (g, h). Data from hypoglycaemic clamps (a, c, e, g) and hyperglycaemic clamps (b, d, f, h) are shown. Target glucose levels (mmol/l) are indicated by the grey double-headed arrows. Black circles and solid lines, HI (BMI ≥27.0 kg/m2; n=15 in a, c, e, g and n=14 in b, d, f, h); white triangles and dashed lines, LO (BMI <27.0 kg/m2; n=15 in all panels); in (g, h), black circles and bars, HI; white triangles and grey bars, LO. Significance estimates refer to comparisons of the AUC (a–f) or total amount of infused glucose (g) for the indicated time periods between groups HI and LO: *p<0.05, **p<0.01, ***p<0.001. Groupwise comparison of central laboratory glucose measures gave similar results as for glucometer measures, which are reported here owing to more frequent sampling. Complete measurements are provided in ESM Table 1. Iso, isoglycaemic phase of hyperglycaemic clamp; Rec, recovery

