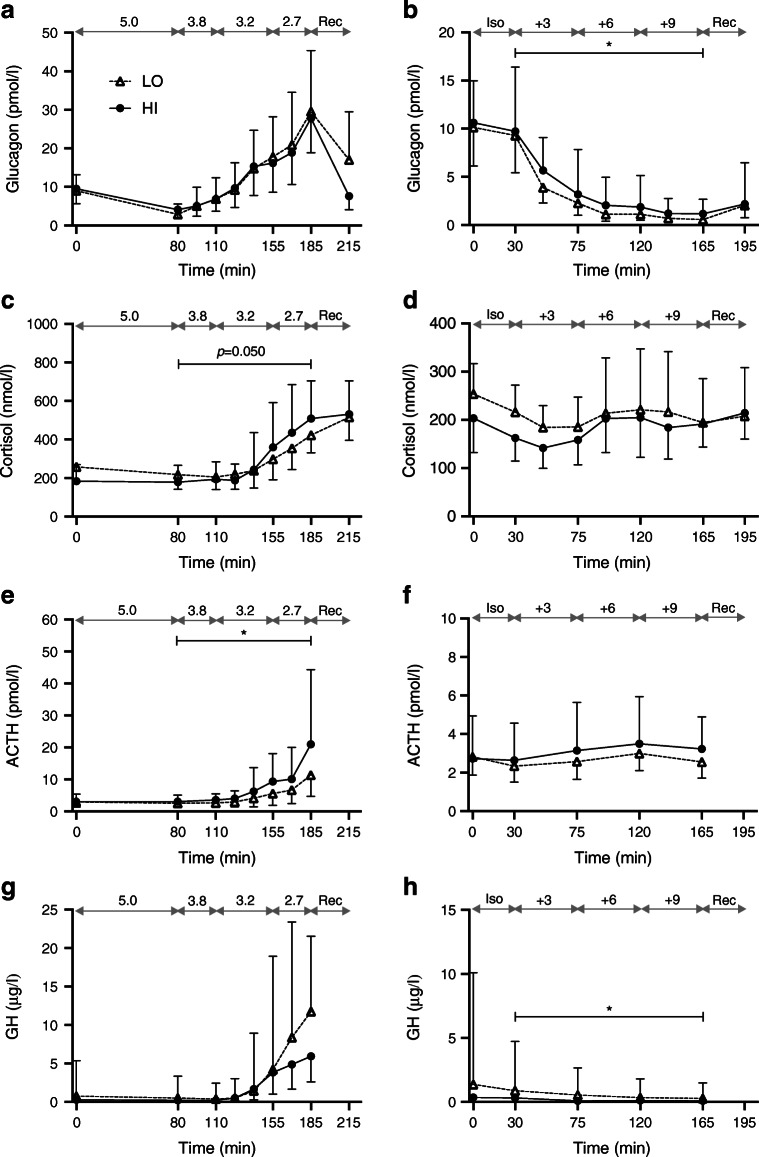
Fig. 3.
Levels of counter-regulatory hormones. Data are presented as geometric means ± geometric SD. Data from hypoglycaemic clamps (a, c, e, g) and hyperglycaemic clamps (b, d, f, h) are shown. Target glucose levels (mmol/l) are indicated by the grey double-headed arrows. Black circles and solid lines, HI (BMI ≥27.0 kg/m2; n=15 in a, c, e, g and n=14 in b, d, f, h); white triangles and dashed lines, LO (BMI <27.0 kg/m2; n=15 in all panels). Significance estimates refer to comparison of ΔAUC (b, c, e) or AUC (h) between groups HI and LO: *p<0.05. Complete measurements are provided in ESM Table 1. GH, growth hormone; Iso, isoglycaemic phase of hyperglycaemic clamp; Rec, recovery

