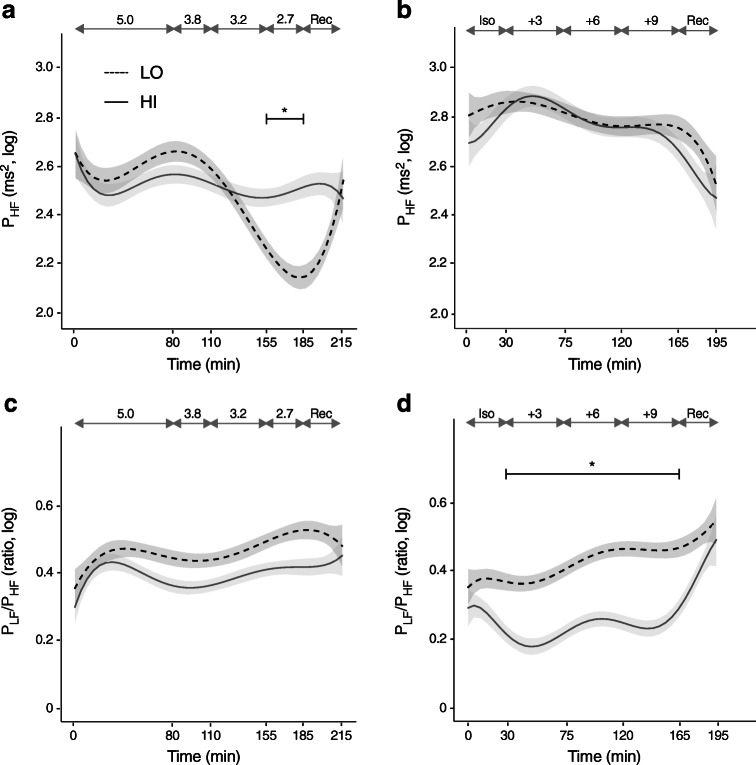
Fig. 4.
HRV spectral components. Data have been log-transformed (base 10) and are presented as means and SEM (shaded area). Data from hypoglycaemic clamps (a, c) and hyperglycaemic clamps (b, d) are shown. Target glucose levels (mmol/l) are indicated by the grey double-headed arrows. Solid lines, HI (BMI ≥27.0 kg/m2; n=15 in a, c and n=14 b, d); dashed lines, LO (BMI <27.0 kg/m2; n=11 in a, c and n=13 in b, d). Significance estimates refer to comparison of mean values of the indicated time period between groups HI and LO adjusted for the mean values during the euglycaemic phase (a) or the isoglycaemic phase (d): *p<0.05. Complete measurements are provided in ESM Table 2. Iso, isoglycaemic phase of hyperglycaemic clamp; Rec, recovery

