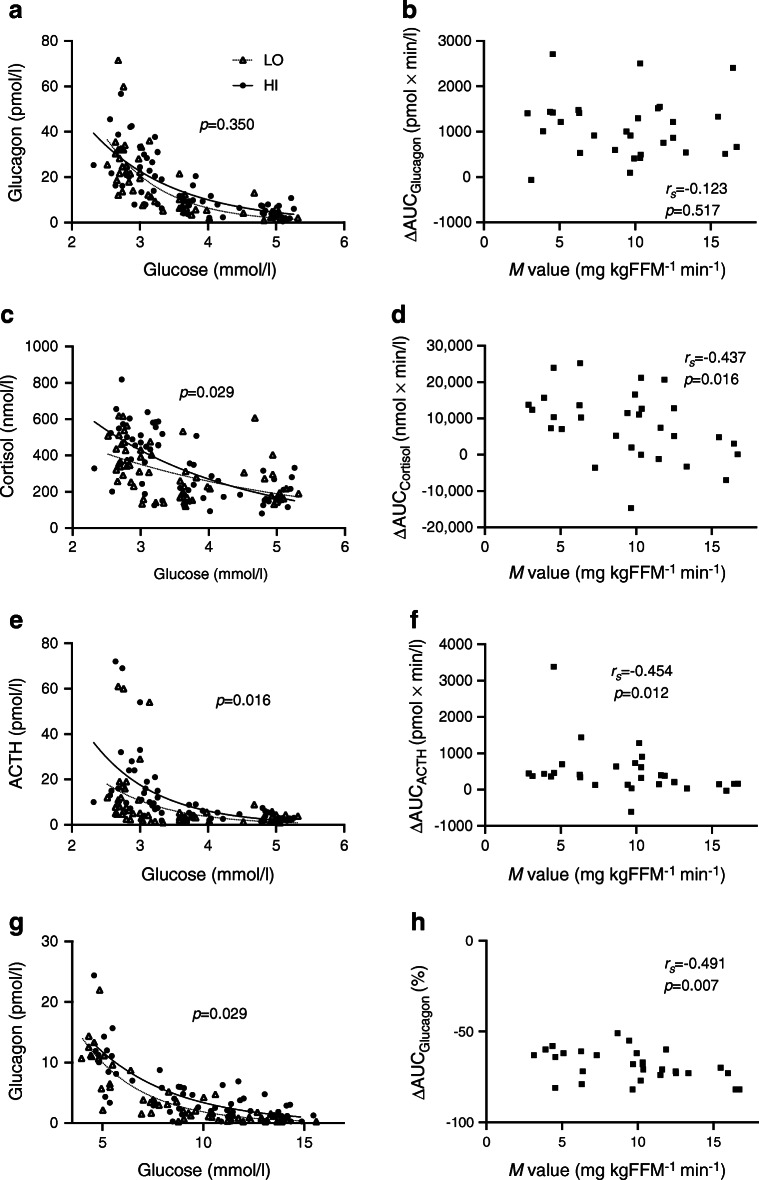
Fig. 5.
Scatterplots of hormone levels vs glucose levels (a, c, e, g) and of ΔAUC of hormones vs M value (b, d, f, h). Hormone levels were measured at the end of each clamp stage vs mean glucometer glucose levels for the preceding 20 min during hypoglycaemic clamps (a, c, e) or hyperglycaemic clamps (g). p values refer to estimates of group differences (a, e, g) or interaction group × glucose (c) in linear mixed models. Black circles, HI (BMI ≥27.0 kg/m2; n=15 in a, c, e and n=14 in g); white triangles, LO (BMI <27.0 kg/m2; n=15 in a, c, e, g); solid lines, exponential regression curve for HI; dotted lines, exponential regression curve for LO; black squares, ΔAUC of the hypoglycaemic phase (80–185 min) (b, d, f; n=30) or the hyperglycaemic phase (30–165 min) (h; n=29) for all participants vs the M value; rs, Spearman’s rho coefficient with corresponding p value

