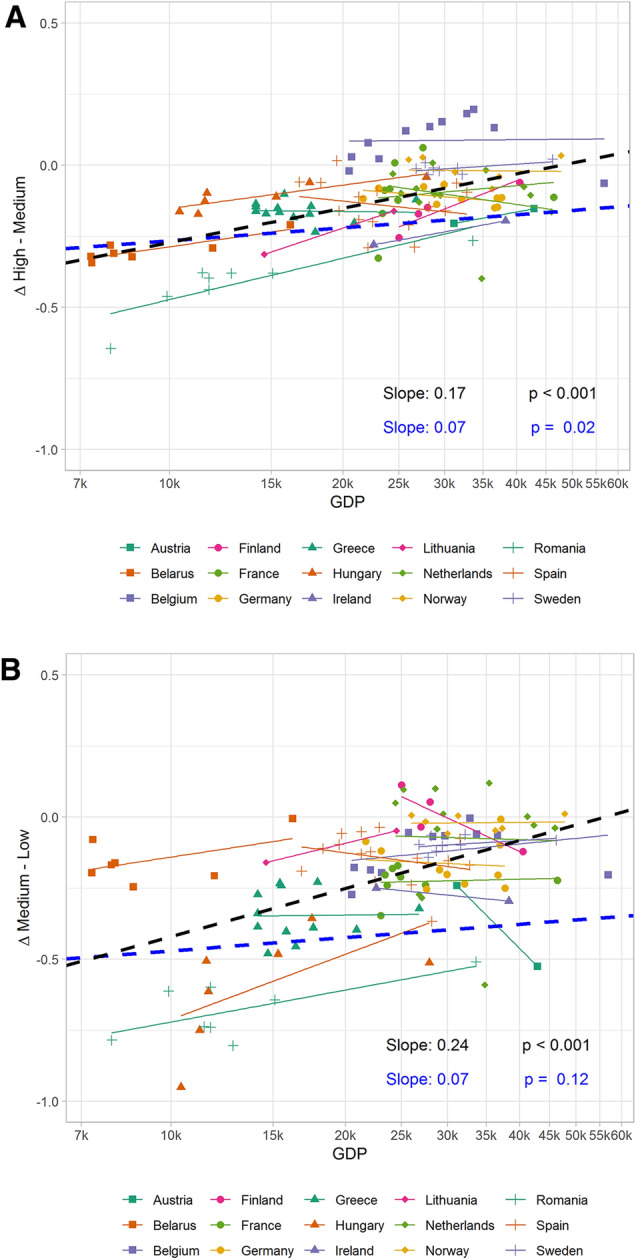
Fig. 1.


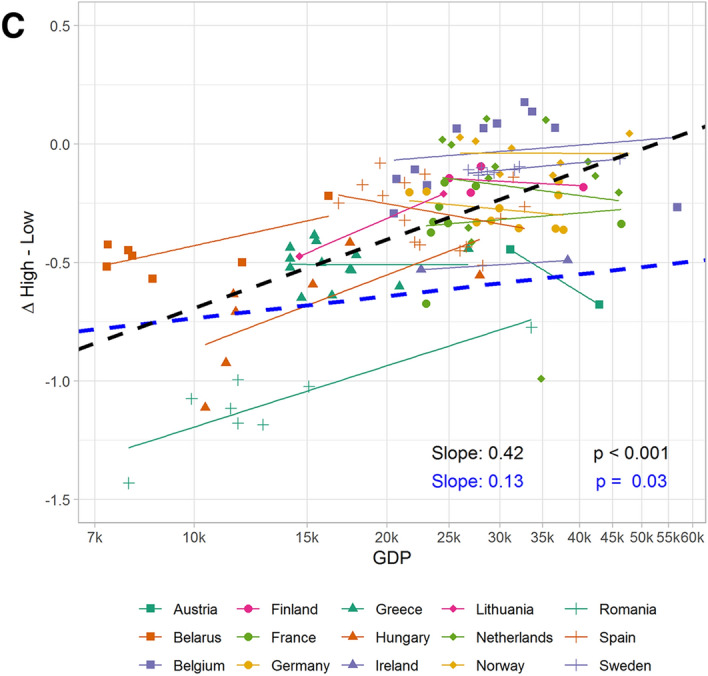
a Difference in cohort fertility rate between high- and medium-educated women according to the GDP per capita level of the region in 15 European countries. Regression lines are fitted for the global trend without (black dashed line) and with (blue dashed line) country fixed effects, and for the within-country trends for each country separately (solid lines). b Difference in cohort fertility rate between medium- and low-educated women according to the GDP per capita level of the region in 15 European countries. Regression lines are fitted for the global trend without (black dashed line) and with (blue dashed line) country fixed effects, and for the within-country trends for each country separately (solid lines). c Difference in cohort fertility rate between high- and low-educated women according to the GDP per capita level of the region of the 15 European countries. Regression lines are fitted for the global trend without (black dashed line) and with (blue dashed line) country fixed effects, and for the within-country trends for each country separately (solid lines)
