Figure 3.

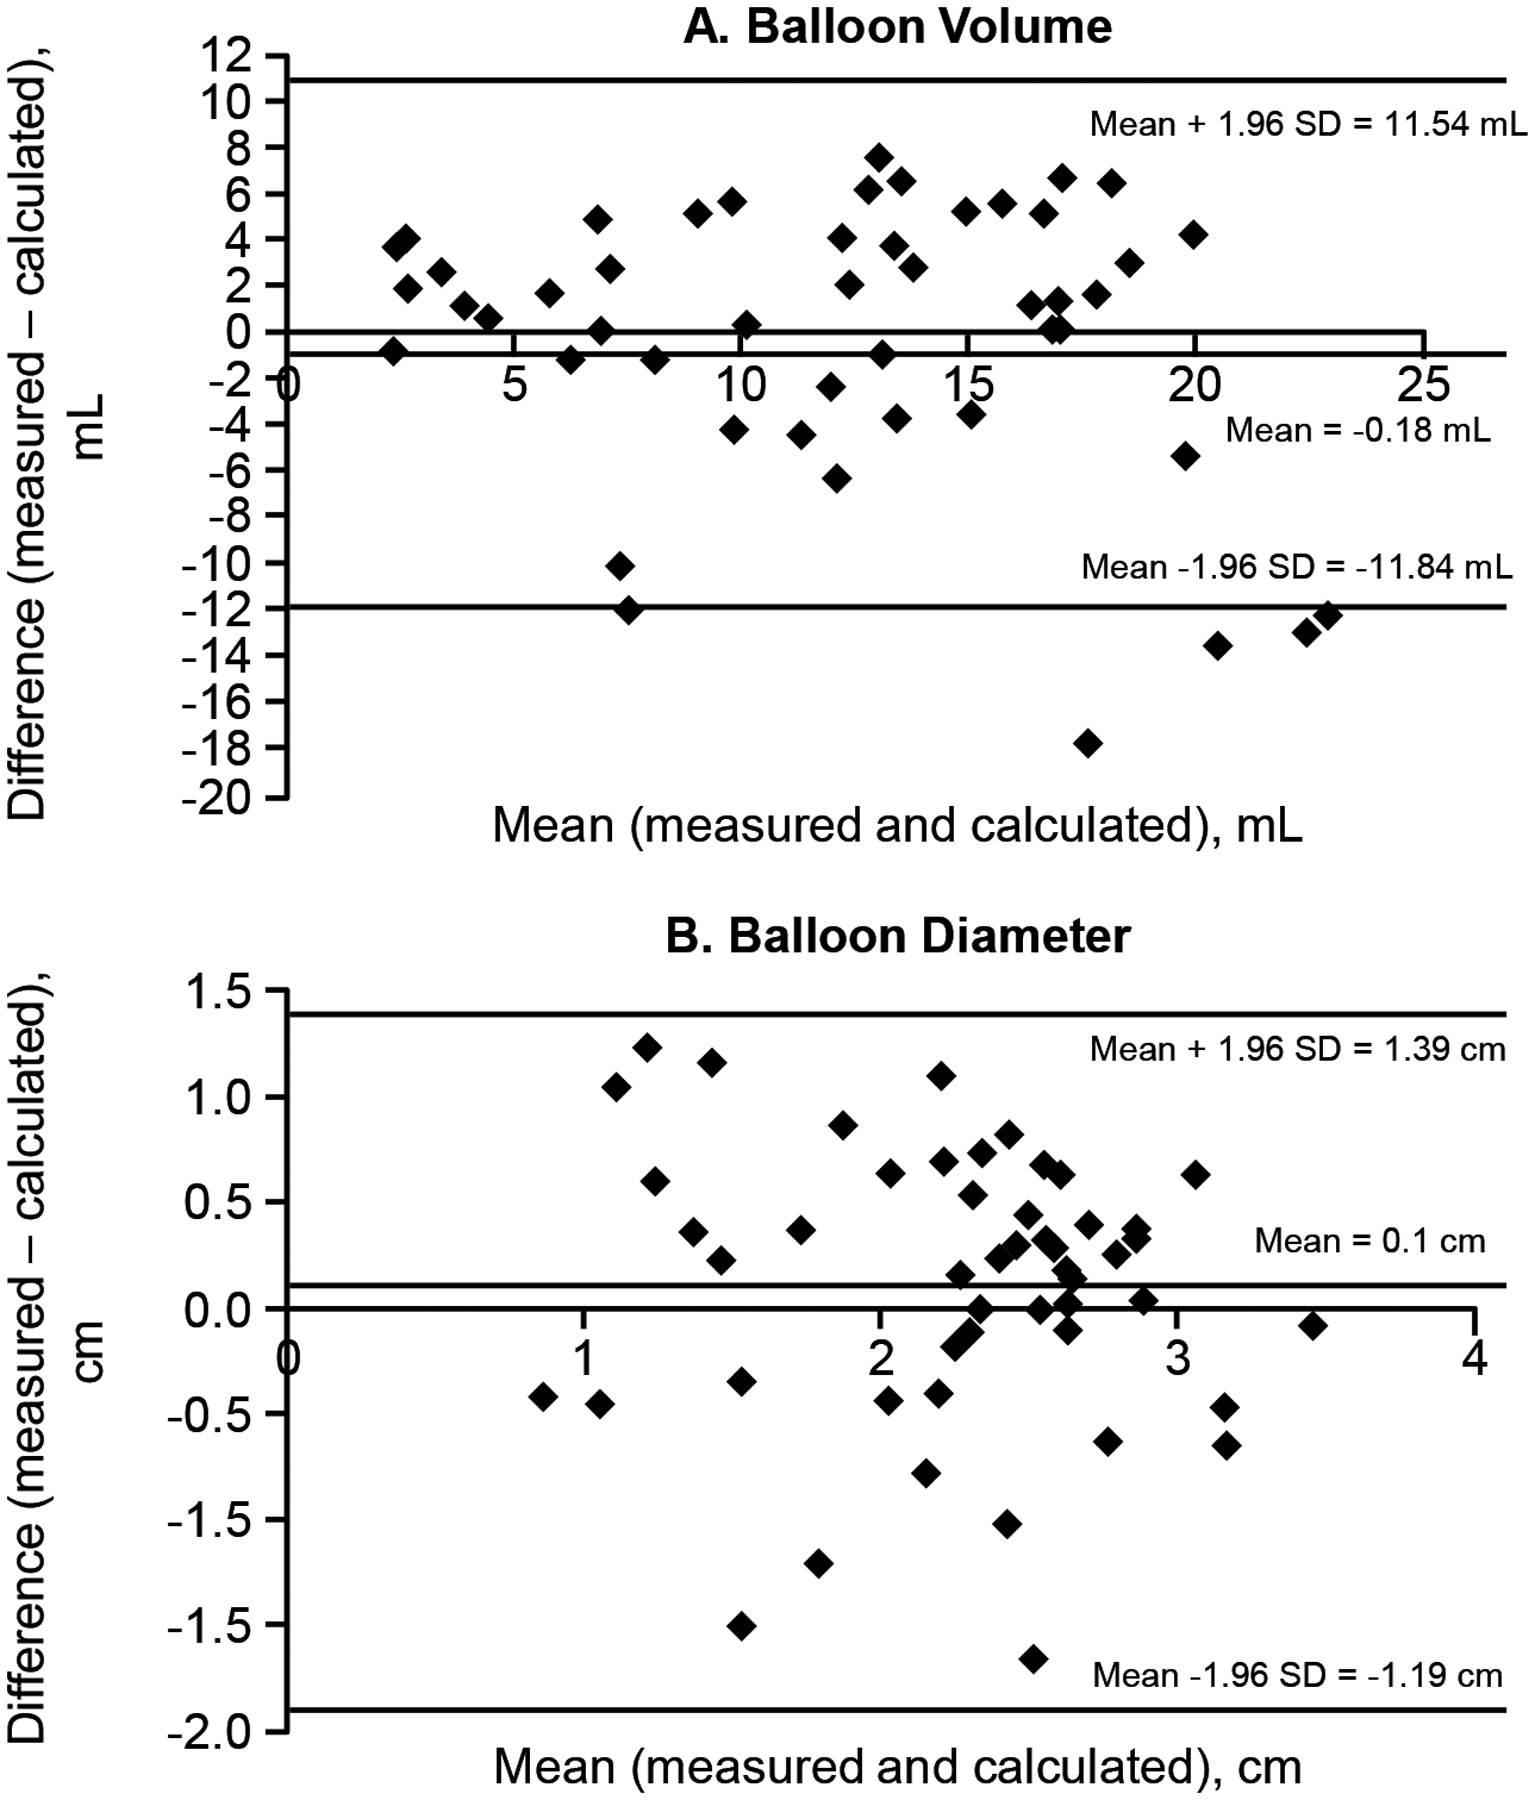
Bland Altman plots showing the agreement between actual and estimated balloon volume (Panel A) and balloon diameter (Panel B) during anal distention. The horizontal lines for each plot are the mean and mean±1.96*SD.

Bland Altman plots showing the agreement between actual and estimated balloon volume (Panel A) and balloon diameter (Panel B) during anal distention. The horizontal lines for each plot are the mean and mean±1.96*SD.