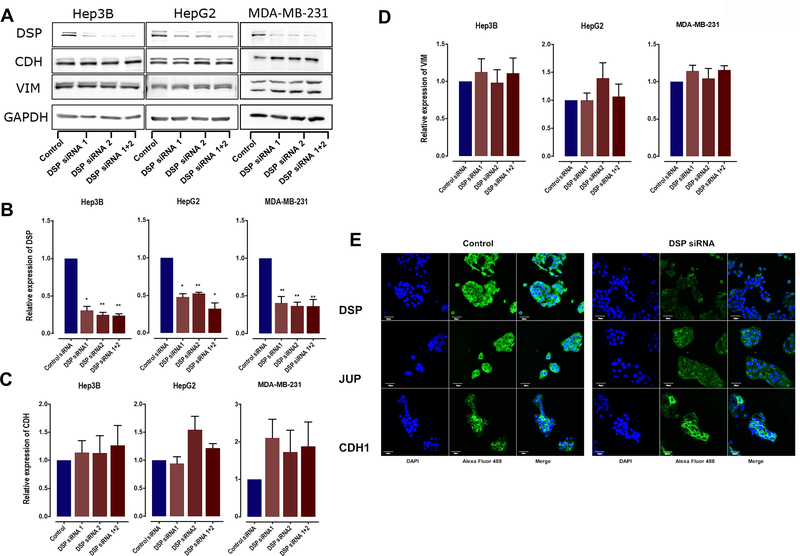
Figure 2.
A: Western Blots showing expression of DSP I + II, CDH1, VIM and GAPDH in HepG2, Hep3B, and MDA-MB-231 cells treated with two individual or pooled DSP siRNAs. B-D. Quantification of the western blots for DSP siRNA-treated HepG2, Hep3B, and MDA-MB-231 cells, comparing the expression levels of DSP, CDH1, and VIM. Bars represent mean ±SE across 3 independent replicates with * indicating Student’s T-test P < 0.05 and ** indicating P < 0.01. E. Confocal images showing the expression and localization of the desmosomal component DSP and JUP, along with CDH1, in HepG2 cells treated with DSP siRNA or scramble siRNA (control). Each image was acquired using uniform image acquisition parameters and the scale bar represents a length of 30μm.

