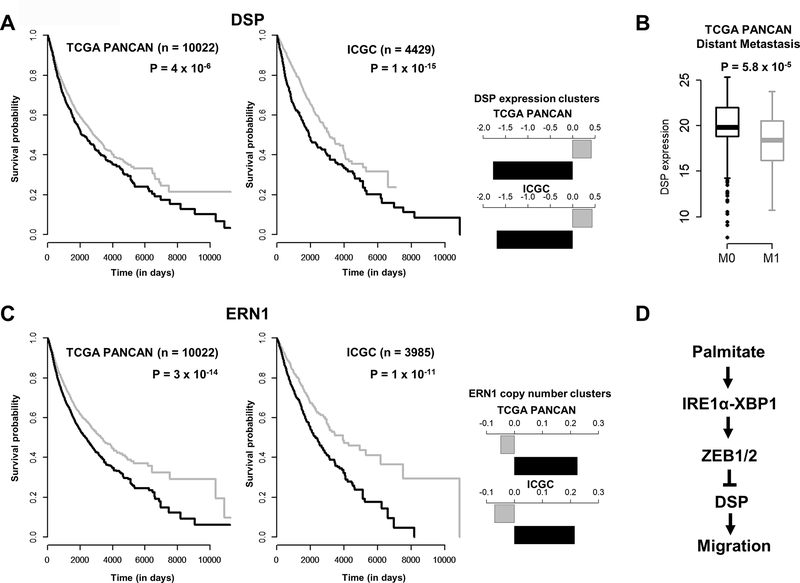
Figure 5.
A: Kaplan-Meier (survival) curves of TCGA PANCAN (n=10022) or ICGC (n=4429) patients grouped according to expression levels of DSP. The samples in each cohort were clustered using K-means (K=2). Barplots on the right indicate centers of the expression clusters in each study. P values indicate significance of the log-rank (Mantel-Cox) test. B. Boxplots comparing the expression levels of DSP in the TCGA PANCAN cohort based on distant metastasis status. M0 indicates no reported indications of metastasis whereas M1 indicates presence of one or more distant metastases. C. Kaplan-Meier (survival) curves of TCGA PANCAN patients grouped according to copy number variation status of ERN1 (IRE1). Samples were clustered using K-means clustering (K=2) based on mean segment copy number, with P values indicating significance of the log-rank (Mantel-Cox) test. D. A proposed PA-induced pathway driving migration of the cancer cells through the loss of DSP mediated by activation of the IRE1-XBP1 pathway and ZEB transcription factors.

