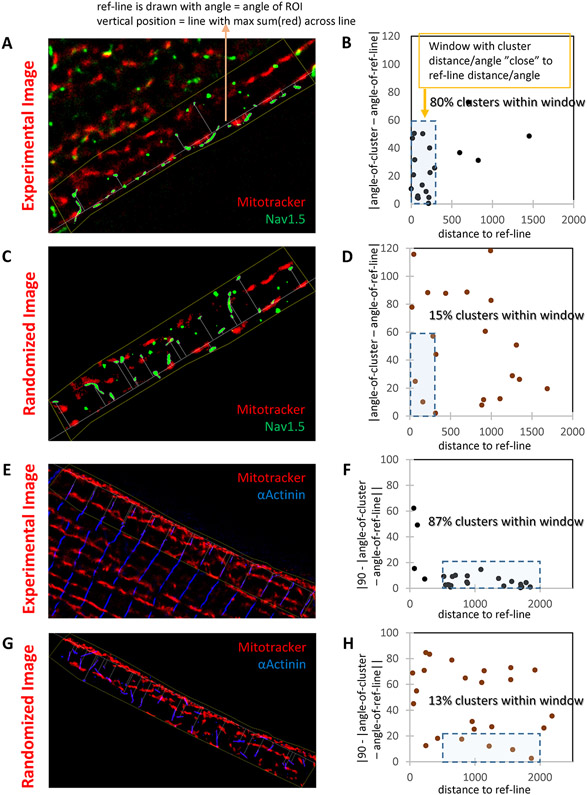
Figure 3. Nav1.5 localizes on top of SSM in a deterministic matter.
A-B: STORM-acquired image of Mitotracker (red) and Nav1.5 (green) from the lateral membrane of an adult murine myocyte (“Experimental image”; A) and data analysis (B). Reference line was traced over the first string of mitochondria under the cell membrane (SSM). This line was used as reference to measure distance to centroid of the Nav1.5 cluster (abscisae in B) and its inclination, namely, the angle of the long axis of the ellipse defining the cluster (ordinates in B). A window of 300 nm and up to 60° in inclination captured 80% of the clusters. Distribution was compared to that obtained by modeling a random distribution of green clusters over the same region of interest (C; “randomized image”). In that condition, only 15% of clusters fell within the same window (D). To validate the model, results were compared to those obtained for a domain established by clusters of known architecture, namely, α-actinin (E: “Experimental image” of Mitotracker (red) and α-Actinin (blue). Analysis in F. In this case, to enhance visualization, the angle of inclination is reported as 90-angle (so perpendicular lines cluster around zero). A similar experiment in the “randomized image” is presented in G-H. As predicted, α-actinin is tightly organized in relation to mitochondria, and such organization is lost when clusters distribute randomly. Distance to reference line measured in nm. Similar results were obtained in n=28 cells from N=4 mice.

