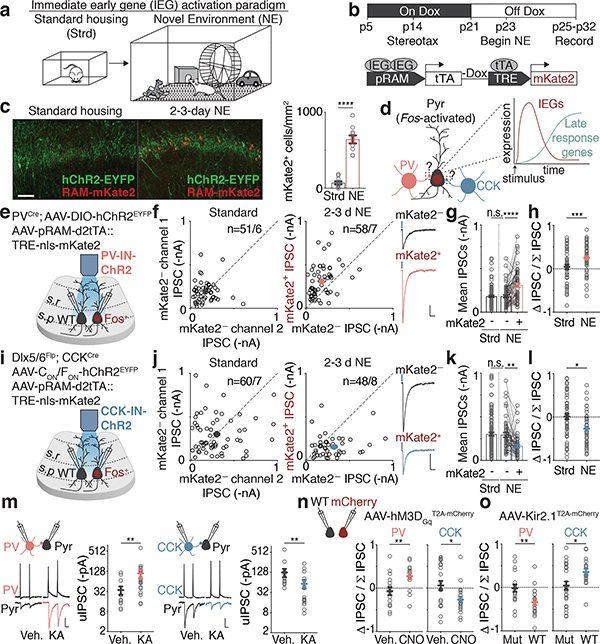
Figure 1. Bidirectional modulation of IN inputs.
a. Schematic of standard housing (Strd) or novel environment (NE).
b. Experimental timeline and configuration of AAV-based activity reporter; mKate2 labeling is temporally controlled via doxycycline (Dox)14.
c. (Left) Representative images depicting Fos-activated neurons (red) and PV-IN-specific channelrhodopsin-2 (ChR2, green) in CA1 in Strd and 2–3d NE. (Right) Number of mKate2+ cells/mm2 in Strd (N=13 mice) and NE (N=10 mice). Scale:100 μm. ****p=2.6×10⁻¹⁰.
d. Schematic of Fos-activated CA1 PCs and its perisomatic-targeting inputs from PV- or CCK-INs. Schematic of activity-induced gene expression kinetics. In the early wave, immediate early genes such as Fos are expressed. Fos subsequently activates late-response genes.
e,i. Schematic of genetic strategy to introduce ChR2 into PV- or CCK-INs and measure light-evoked IPSCs.
f. Scatter plots of recorded pairs of (Left) mKate2— neurons in Strd (n=51/6) or (Right) mKate2+ and mKate2— pairs after 2–3d NE (n=58/7). Representative traces from a pair of neurons shown; blue marks depict light onset. Scale:100 pA;40 ms.
g. Mean PV-IPSC amplitudes from f. ****p=3.2×10⁻⁶.
h. Normalized differences in PV-IPSC amplitudes between pairs of neurons in f (Methods),***p=3.4×10⁻⁴.
j-l. As in f-h for CCK-IPSCs. Strd,n=60/7; NE,n=48/8. Scale:100 pA;40 ms. (k)**p=5.5×10⁻³. (l)*p=0.014.
m. IN-to-CA1 PC paired recording configuration, representative traces and uIPSC amplitudes for (Left) PV-to-CA1 (Vehicle(Veh.),n=13/6; KA,n=19/7; **p=0.003) or (Right) CCK-to-CA1 pairs (Veh.,n=16/9; KA,n=16/4; **p=0.010). Scale: 30 mV;20 pA;20 ms. Mann-Whitney test (two-sided).
n. (Left) PV- and (Right) CCK-IPSC amplitudes of pairs of non-transduced (WT) and hM3DGq (mCherry+) neurons after 24h vehicle or CNO treatment. PV (Veh.,n=16/5; CNO,n=16/7; **p=0.006); CCK (Veh.,n=22/5; CNO,n=21/7; *p=0.014).
o. As in n but with Kir2.1. Control is a non-conducting mutant (KirMut). Mice were exposed to 7–10d NE, a period over which many CA1 PCs would have turned on Fos (Extended Data Fig. 1c,d). PV (KirMut,n=18/3; Kir2.1,n=19/5; **p=0.007); CCK (KirMut,n=25/3; Kir2.1,n=17/4; *p=0.023).
(f,h,j,l,m-o) Each open circle represents a pair of simultaneously recorded neurons.
(c,f-h,j-o) Mean±SEM.
(f,j,m-o) n=number of pairs/mice.
(c,k,l,n,o) Two-sided t-test. (g,k) Ordinary one-way ANOVA, multiple comparisons corrected.

