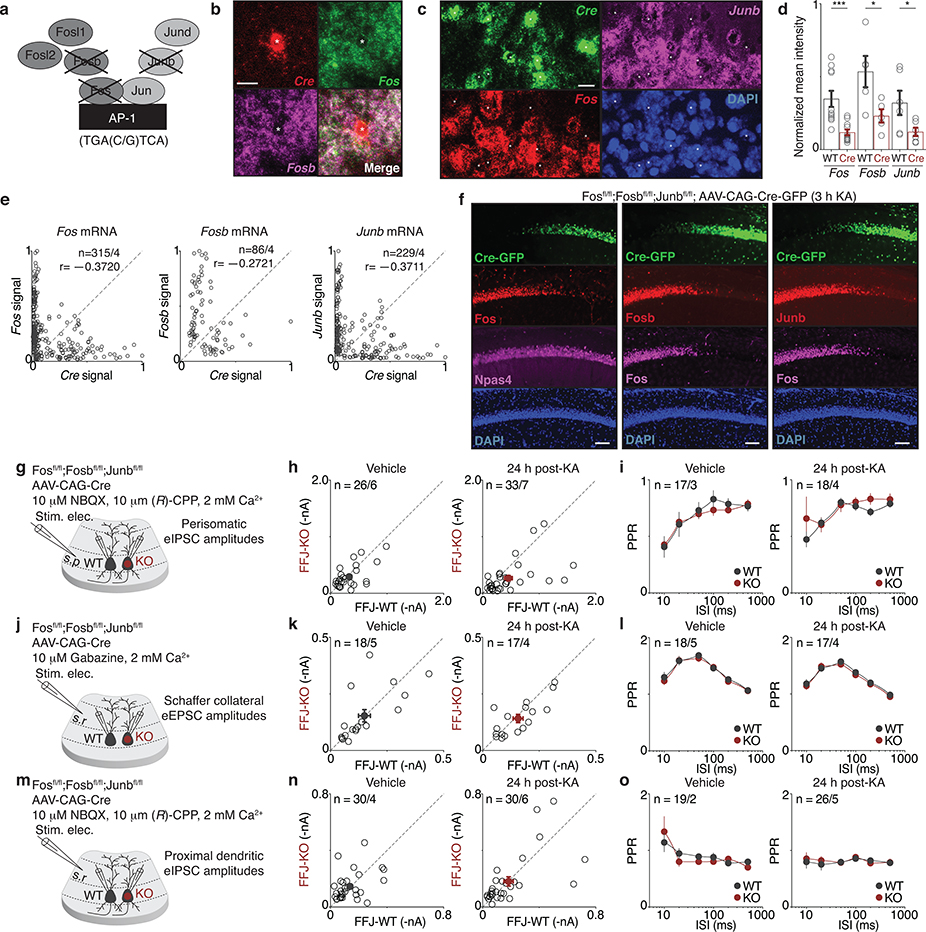
Extended Data Figure 4. Validation of Fosfl/fl;Fosbfl/fl;Junbfl/fl (FFJ) mouse line and additional electrophysiological parameters in FFJ-WT and KO cells.
a. Schematic representation of the AP-1 members conditionally deleted in FFJ line.
b,c. Representative images of smRNA-FISH validating loss of Fos and Fosb (and Junb in c) upon Cre expression in the CA1 field of 1–1.5 h post-KA-injected FFJ mice. Scale: 20 μm. N = 4 mice.
d. (Right) Normalized pixel intensity for Cre-negative and Cre-positive cells. Each point represents average for individual sections across N = 4 mice. Fos, ***p=7.7×10⁻⁴; Fosb, *p=0.031; Junb, *p=0.047.
e. Scatter plots of normalized pixel intensities of Cre signal against Fos, Fosb or Junb signals for each cell. Pearson correlation coefficients (r) shown. Fos, n = 315; Fosb, n = 86; Junb, n = 229 cells from N = 4 mice.
f. Representative images of Cre-injected FFJ sections immunostained for Fos, Fosb, Junb, and Npas4 proteins in the CA1 field of 3 h post-KA. Scale: 100 μm. N = 3 mice.
g,j,m. Schematic of stimulus electrode placement in stratum pyramidale to stimulate perisomatic inhibitory axons (g), or stratum radiatum to stimulate Schaffer collaterals (j) or proximal dendritic inhibitory axons (m).
h,k,n. Scatter plots of recorded pairs of FFJ-WT and FFJ-KO CA1 PCs in 24 h post-vehicle (Left) or -KA injected (Right) mice, where (h) Veh., n = 26/6; KA, n = 33/7; (k) Veh., n = 18/5; KA, n = 17/4; (n) Veh., n = 30/4; KA, n = 30/6.
i,l,o. Quantification of PPRs for indicated currents, where (i) Veh., n = 17/3; KA, n = 18/4; (l) Veh., n = 18/5; KA, n = 17/4; (o) Veh., n = 19/2; KA, n = 26/5.
(h,i,k,l,n,o) n = number of pairs/mice.
(d,h,i,k,l,n,o) Mean ± SEM.

