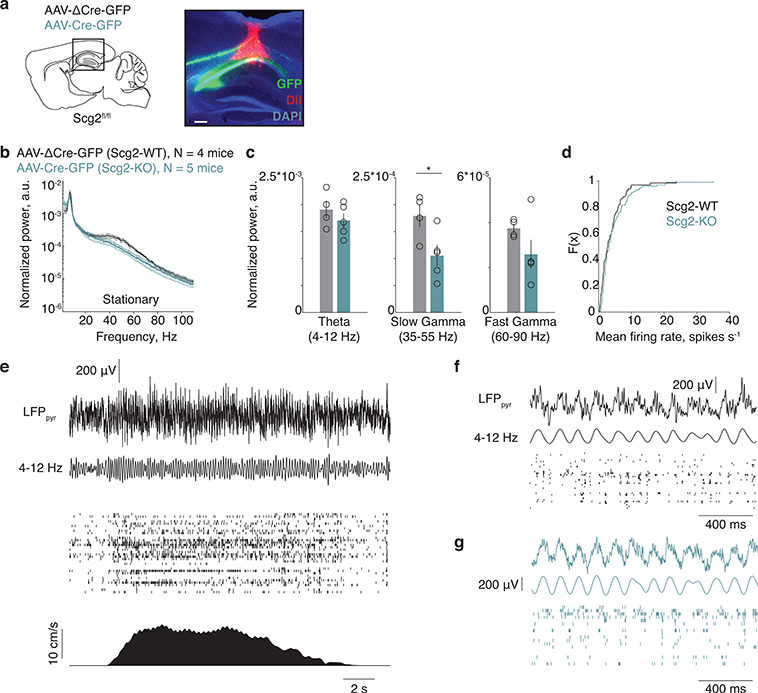
Extended Data Figure 10. Silicon probe recordings in Scg2-WT and Scg2-KO mice to assess effects on network oscillations.
a. (Left) Schematic of stereotaxic injection and recording site in CA1 pyramidal layer. (Right) Representative image of silicon probe placement in CA1 pyramidal layer with Cre-GFP (green) and Dil (red). N = 4 mice. Scale: 200 μm.
b. Normalized power spectrum of network oscillations in Scg2-WT or KO mice during stationary periods. Average across Scg2-WT (grey, N = 4) or Scg2-KO (green, N = 5) mice, one session per mouse. Mean ± SEM.
c. Mean of the normalized power spectra within theta, slow gamma, and fast gamma bands during stationary periods as shown in b. Two-sided t-test, * p = 0.037. Mean ± SEM.
d. Cumulative histogram of mean firing rate for all Scg2-WT and Scg2-KO units. Mean firing rate is not significantly different (two-sided t-test, p = 0.2138). Scg2-WT (n = 67 units) and Scg2-KO (n = 103 units).
e. Example local field potential (LFP), single-unit activity, and running speed in a Scg2-WT mouse. From top to bottom: Denoised and downsampled LFP, 4–12 Hz bandpass filtered LFP, population spiking activity raster plot, and smoothed running speed.
f. Expanded snippet of data from the example in e. From top to bottom: Denoised and downsampled LFP, 4–12 Hz bandpass filtered LFP, and population spiking activity raster plot.
g. As in f with example data from a Scg2-KO mouse.
(a) Schematic image (left) adapted with permission from Paxinos & Franklin (Elsevier),

