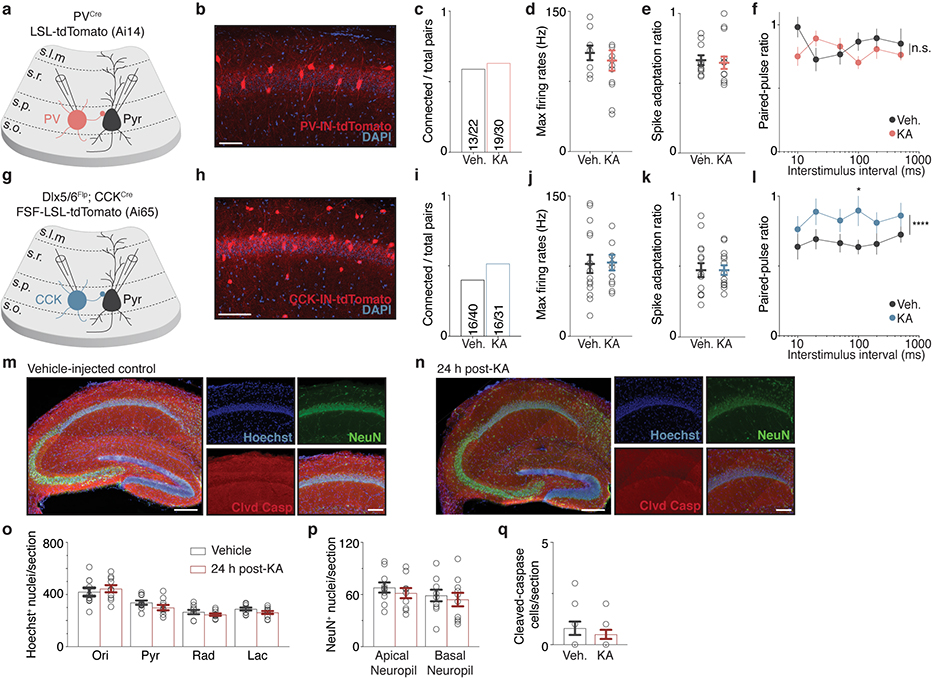
Extended Data Figure 2. IN-to-CA1 PC paired recordings and cell health parameters in 24 h post-KA condition.
a,g. Schematic of genetic strategy to label PV-INs (PVCre;Ai14) or CCK-INs (Dlx5/6Flp;CCKCre;Ai65).
b,h. Representative images of tdTomato fluorescence in the CA1 field. Scale: 100 μm. N = 2 mice per line.
c,i. Quantification of the fraction of (c) PV- or (i) CCK-to-CA1 PC synaptically-connected pairs from the overall number of pairs recorded in both vehicle (Veh.) and 24 h post-KA mice. (c) Veh., n = 13/22; KA, n = 19/30; (i) Veh., n = 16/40; KA, n = 16/3, where n = connections/total pairs.
d,j. Quantification of maximum firing rate of (d) PV- or (j) CCK-INs from connected pairs. (d) Veh., n = 10/6; KA, n = 14/7; (j) Veh., n = 15/9; KA, n = 14/4, where n = cells/mice.
e,k. Quantification of spike adaptation ratio of (e) PV- or (j) CCK-INs from connected pairs as in d,j.
f,l. Quantification of paired pulse ratios (PPRs) of uIPSCs at the indicated interstimulus intervals (ISI) for (f) PV- (Veh., n = 13/6; KA, n = 19/7) or (l) CCK- (Veh., n = 16/9; KA, n = 16/4) to-CA1 PC connected pairs, where n = pairs/mice. Two-sided t-tests performed at each ISI or for all ISIs comparing Veh. and 24 h KA conditions; *p=0.039, ****p=4.4×10⁻⁵.
m,n. Representative hippocampal images from (m) Veh. and (n) 24 h post-KA conditions. Sections were immunostained for NeuN (green) and cleaved-caspase 3 (red), and counterstained with Hoechst (blue). Scale: 200 μm (left); 100 μm (right, CA1 field). N = 2 mice per condition.
o-q. Quantification of (o) Hoechst+ nuclei, (p) NeuN+ nuclei, and (q) Cleaved-caspase+ cells per 40-μm section in all layers of CA1. Results suggest that KA injection does not induce cell death within 24 h. Veh. and KA, n = 10 sections/2 mice, respectively.
(d-f,j-l,o-q) Mean ± SEM.

