
Figure 7: Draper-dependent signaling functions in glia to suppress axon transport in the intact neurons. (See also Figures S8.).
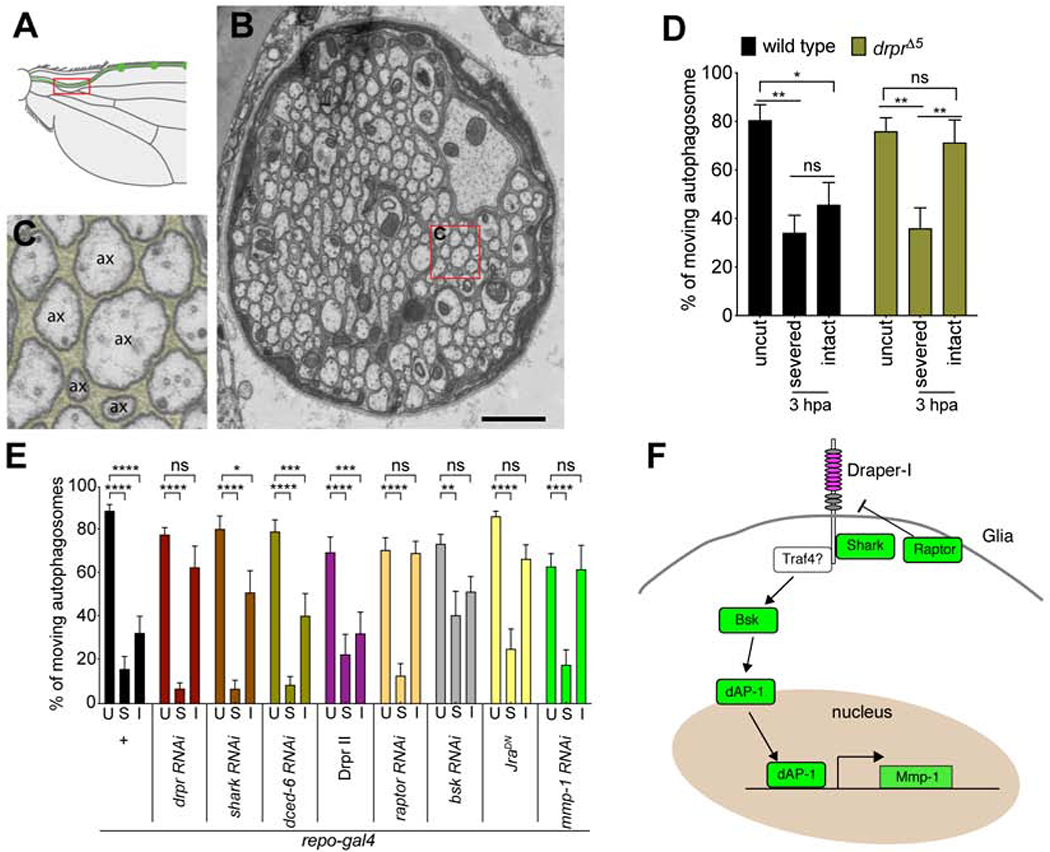
(A) Schematic shows that the region where transmission electron microscopy (TEM) image was taken (red rectangle). (B) TEM image of the nerve in L1 wing vein. Red rectangle indicates the selected region of (C). Scale bar = 1μm. (C) 5x magnified TEM image from the indicated region on (B). Glia are pseudocolored. ax = axon. (D) Severed axons, but not intact axons, showed decrease of axon transport after axonal injury 3hpa in drprΔ5 homozygote flies. Two-way ANOVA with Sidak multiple comparisons test. (ns = not significant, *p < 0.05, **p < 0.01, n = 10~20 axons of each, Error bar = S.E.M.). (E) Quantifications of autophagosome transport in glial-specific RNAi knockdown, or overexpression (repo-gal4, uas-transgenes) neurons of the genes indicated. Two-way ANOVA with Sidak multiple comparisons test. U = uncut, S = severed axons, I = intact bystander neurons (ns = not significant, *p < 0.05, **p < 0.01, ***p < 0.001, ****p < 0.0001, n = 10~20 axons of each, Error bar = S.E.M.). (F) Schematic showed the model of Draper-dependent glial signaling pathway to suppress axon transport in bystander intact neurons.