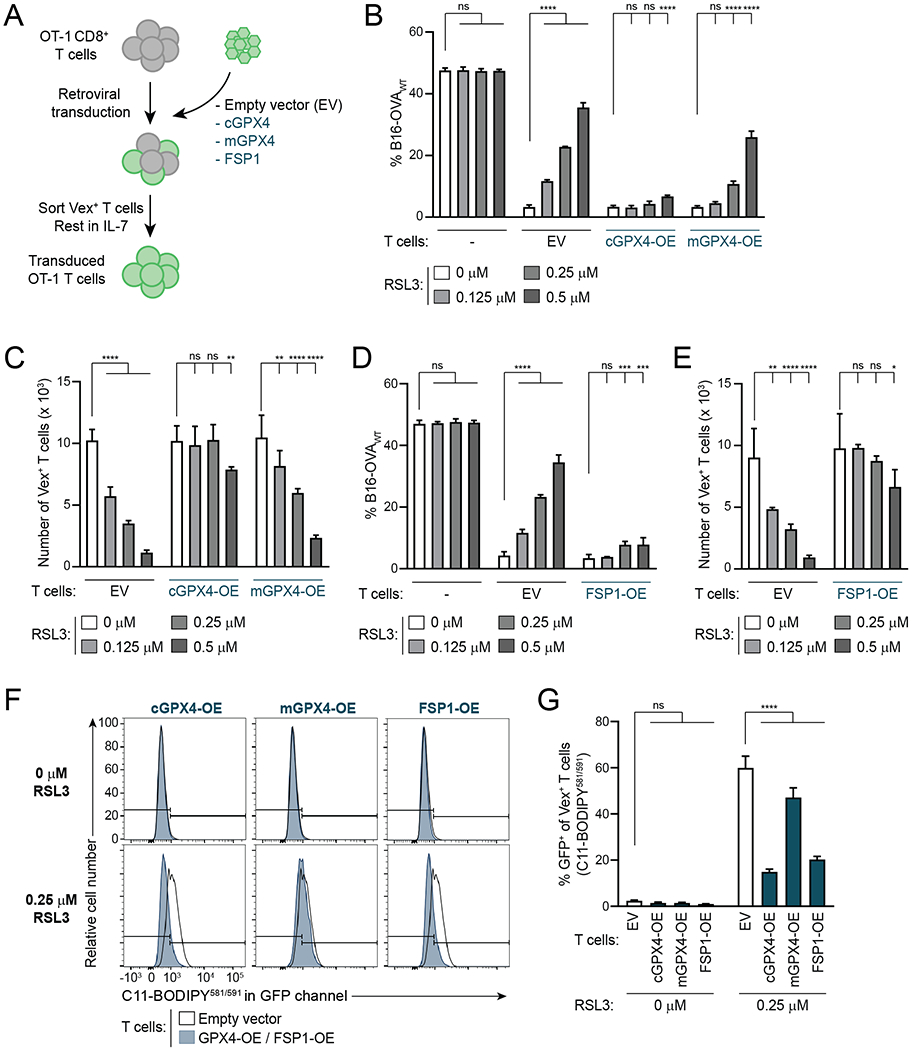
Figure 4. Overexpression of FSP1 or Cytosolic GPX4 Reduces Ferroptosis Sensitivity in CD8+ T Cells.

A, Schematic depicting generation of GPX4- and FSP1-OE OT-1 CD8+ T cells.
B–E, Specific killing (B,D) and T cell numbers (C,E) at the end of killing assays with GPX4-OE (B,C) or FSP1-OE (D,E) OT-1 T cells and EV control OT-1 T cells. n=2-6 technical replicates per condition. Statistical significance determined by two-way ANOVA.
F,G, Representative examples (F) and quantification (G) of C11-BODIPY581/591 staining of OT-1 EV, GPX4-OE and FSP1-OE T cells treated with indicated concentrations of RSL3 for 24hr after 72hr activation. Flow plots in F compare each condition to the same EV control sample. n=3-4 technical replicates per condition. Statistical significance determined by two-way ANOVA.
*p<0.05 **p<0.01 ***p<0.001 ****p<0.0001. ns, not significant. Graphs display mean +/− SD. Data representative of ≥2 independent experiments.
