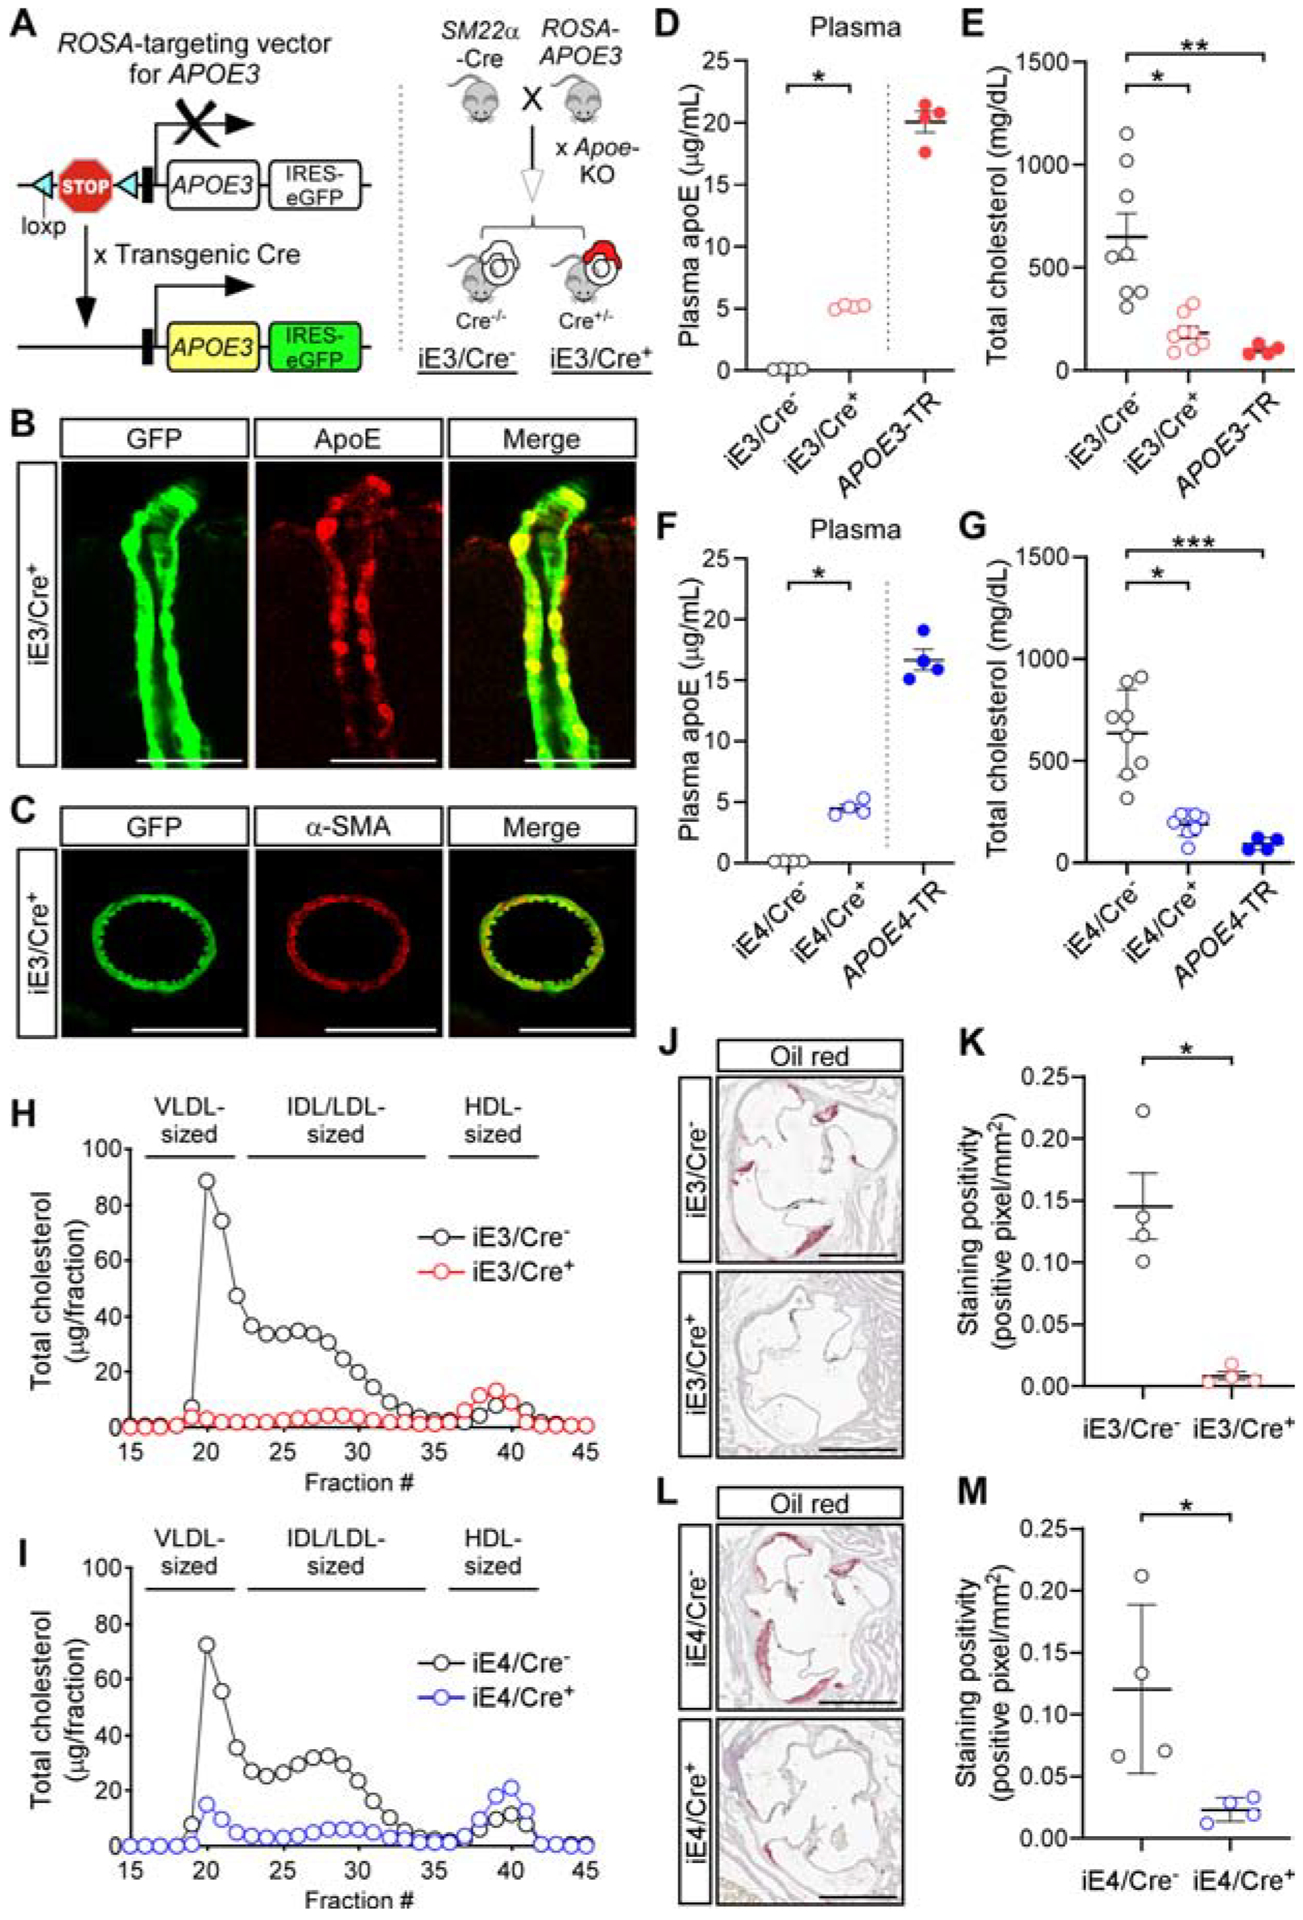
Figure 1. Generation and characterization of conditional mouse models expressing human apoE isoforms in VMCs.

(A) Strategy for generating vascular APOE conditional mouse models.
(B and C) Brain sections from iE3/Cre+ mice immunostained for apoE (B), and smooth muscle cell marker (C, α-smooth muscle actin, α-SMA). Representative images are shown. Scale bar, 50 μm (B), 100 μm (C).
(D) The amount of apoE in plasma was determined by ELISA in iE3/Cre− (n=4, 2 males, 2 females) and iE3/Cre+ mice (n=4, 2 males, 2 females) with APOE3-TR mice (n=4, 2 males, 2 females) as controls. *P<0.05, iE3/Cre− vs. iE3/Cre+, Mann-Whitney test. Data in this and subsequent figures represent mean ± SEM.
(E) Total amount of plasma cholesterol was determined in iE3/Cre− (n=8, 4 males, 4 females), iE3/Cre+ (n=8, 4 males, 4 females), and APOE3-TR mice (n=4, 2 males, 2 females). **P<0.01, iE3/Cre− vs. APOE3-TR; *P<0.05, iE3/Cre− vs. iE3/Cre+, Kruskal-Wallis test followed by Dunn’s multiple comparison tests.
(F) The amount of apoE in plasma was determined by ELISA in iE4/Cre− (n=4, 2 males, 2 females), iE4/Cre+ mice (n=4, 2 males, 2 females), and APOE4-TR mice (n=4, 2 males, 2 females). *P<0.05, iE4/Cre− vs. iE4/Cre+, Mann-Whitney test.
(G) Total amount of plasma cholesterol was determined in iE4/Cre− (n=8, 4 males, 4 females), iE4/Cre+ (n=8, 4 males, 4 females), and APOE4-TR mice (n=4, 2 males, 2 females). ***P<0.001, iE4/Cre− vs. APOE4-TR; *P<0.05, iE4/Cre− vs. iE4/Cre+, Kruskal-Wallis test followed by Dunn’s multiple comparison tests.
(H) Size distribution profile of plasma cholesterol in iE3/Cre− (n=4, 2 males, 2 females) and iE3/Cre+ mice (n=4, 2 males, 2 females).
(I) Size distribution profile of plasma cholesterol in iE4/Cre− (n=4, 2 males, 2 females) and iE4/Cre+ mice (n=4, 2 males, 2 females).
(J and K) Atherosclerotic lesions in the aortic root of iE3/Cre− (n=4, 2 males, 2 females) and iE3/Cre+ mice (n=4, 2 males, 2 females) were visualized by oil-red staining (J) and quantified (K). Scale bar, 1,000 μm (J). *P<0.05, iE3/Cre− vs. iE3/Cre+, Student t-test.
(L and M) Atherosclerotic lesions in the aortic root of iE4/Cre− (n=4, 2 males, 2 females) and iE4/Cre+ mice (n=4, 2 males, 2 females). Scale bar, 1,000 μm (L). *P<0.05, iE4/Cre− vs. iE4/Cre+, Student t-test.
See also Figure S1.
