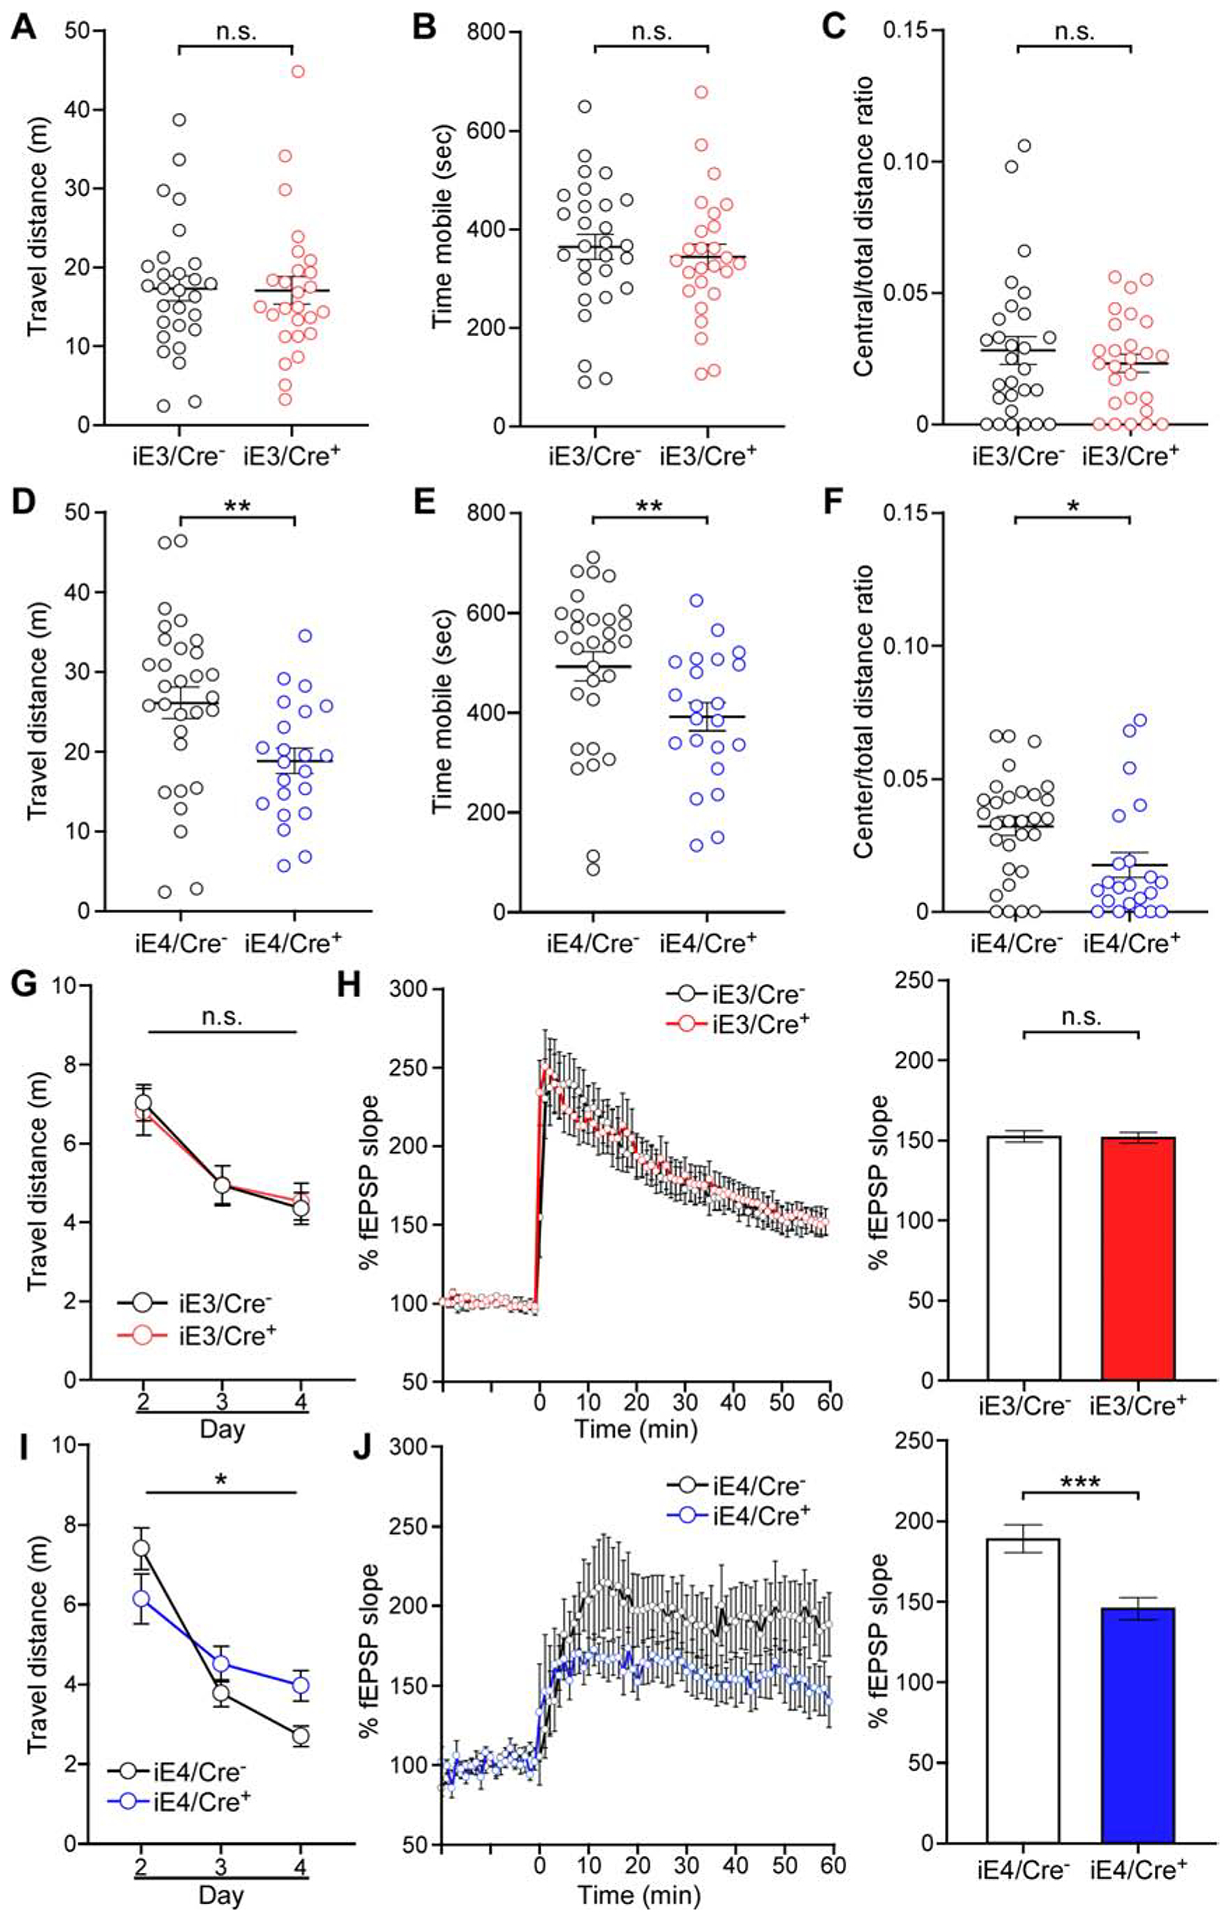
Figure 2. VMC-derived apoE4 increases anxiety-like behavior, and impairs spatial learning and synaptic plasticity.

(A-C) Total distance travelled (A), time spent mobile (B), and center to total distance ratio (C) of iE3/Cre− and iE3/Cre+ mice in the OFA tests. n.s., not significant, iE3/Cre− vs. iE3/Cre+, Student t-test (A) and Mann-Whitney test (B and C). Data in this and subsequent figures represent mean ± SEM.
(D-F) Same analyses as in A, B and C except for comparing iE4/Cre− and iE4/Cre+ mice. **P<0.01, iE4/Cre− vs. iE4/Cre+, Student t-test (D). **P<0.01, *P<0.05, iE4/Cre− vs. iE4/Cre+, Mann-Whitney test (E and F).
(G) Travelled distance to visible platform of iE3/Cre− and iE3/Cre+ mice in the MWM test plotted against the training days. n.s., not significant, iE3/Cre− vs. iE3/Cre+, repeated measures ANOVA.
(H) Left, normalized fEPSP responses to field stimulation in the CA1 region of hippocampal slices from iE3/Cre− (n=5, all males) and iE3/Cre+ mice (n=6, all males). Right, averages of the last 5 min of fEPSP recording were quantified. n.s., not significant, iE3/Cre− vs. iE3/Cre+, Mann-Whitney test.
(I and J) Same analyses as in G and H except for comparing iE4/Cre− and iE4/Cre+ mice. *P<0.05, iE4/Cre− vs. iE4/Cre+, repeated measures ANOVA (I). ***P<0.001, iE4/Cre− vs. iE4/Cre+, Mann-Whitney test (J).
