
Figure 4.
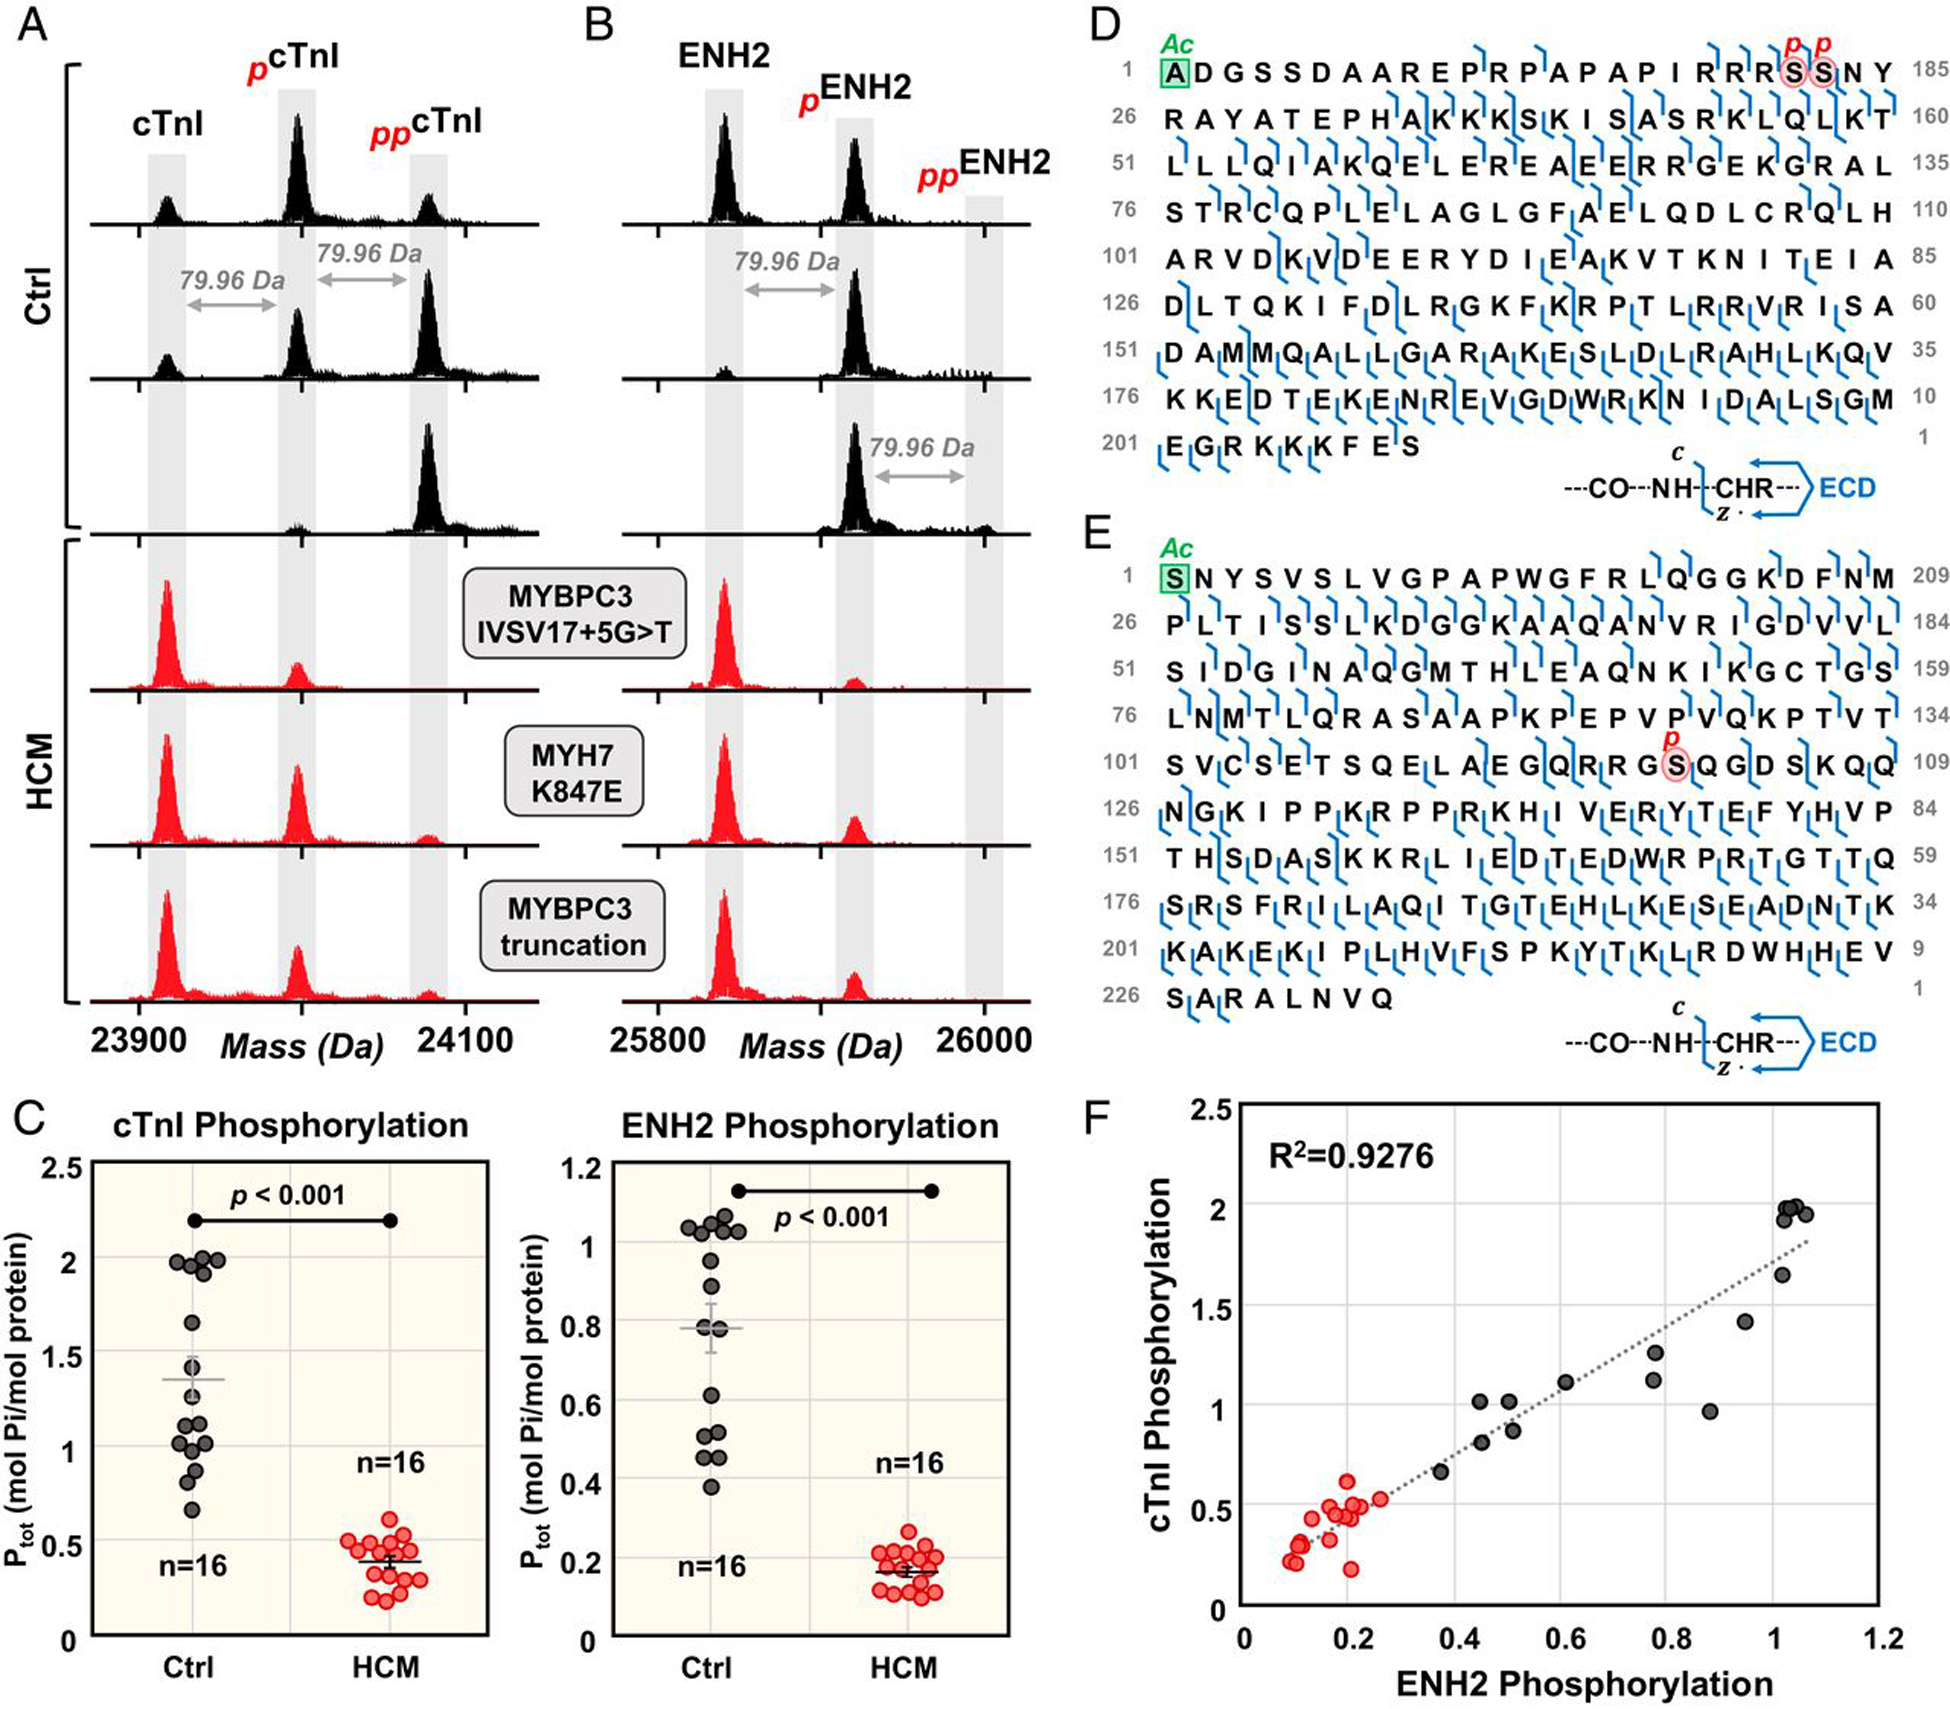
Top-down proteomics reveals a common proteoform profile in patients with hypertrophic cardiomyopathy (HCM). Coordinated decrease in cTnI and ENH2 phosphorylation in HCM tissues. Representative deconvoluted mass spectra for (A) cTnI and (B) ENH2 from donor hearts (black) and HCM tissues (red). Mono- and bis-phosphorylation are denoted by red p and pp, respectively. (C) Total protein phosphorylation (Ptot) calculated by mol Pi/mol protein for cTnI and ENH2 in Ctrl (n = 16) and HCM (n = 16). Horizontal bars represent the mean of the group and error bars represent SEM in gray for Ctrl and black for HCM. Groups were considered significantly different at P < 0.05. (D) Localization of cTnI phosphorylation to Ser22/23 and (E) localization of ENH2 phosphorylation to Ser118 by ECD. (F) Linear correlation between cTnI phosphorylation and ENH2 phosphorylation (R2 = 0.9276). Figure from reference [149]. Copyright 2020 National Academy of Sciences.