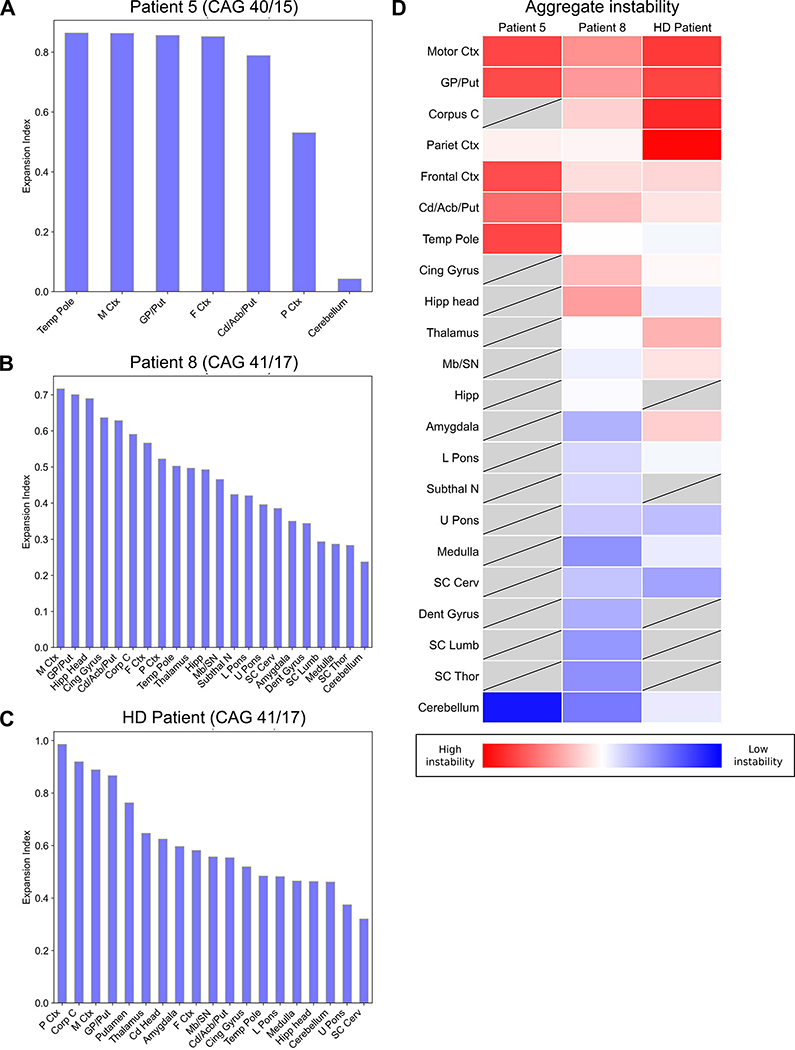
Figure 2. Quantitative analysis of somatic HTT mosaicism across brain regions in FTD/ALS and Huntington’s disease patients.
(A-C) Measurements of somatic mosaicism across brain regions obtained at autopsy for Patient #5, Patient #8, and a Huntington’s disease patient. (D) Heat map of the expansion indices aggregated for the three patients, with tissues displayed in order of mean expansion index. Grey boxes indicate regions that were not assessed. M Ctx, Motor Ctx = motor cortex; GP/Put = globus pallidus/putamen; Corp C, Corpus C = corpus callosum; P Ctx, Pariet Ctx = parietal cortex; F Ctx, Frontal Ctx = superior frontal cortex; Cd/Acb/Put = caudate/accumbens/putamen; Temp Pole = temporal pole; Cing Gyrus = cingulate gyrus; Hipp head = head of the hippocampus; Mb/SN = midbrain/substantia nigra; Hipp = hippocampal formation; L Pons = lower pons; Subthal N = subthalamic nucleus; U Pons = upper pons; SC Cerv = cervical spinal cord; Dent Gyrus = dentate gyrus; SC Lumb = lumbar spinal cord; SC Thor = thoracic spinal cord. See also Figure S4.

