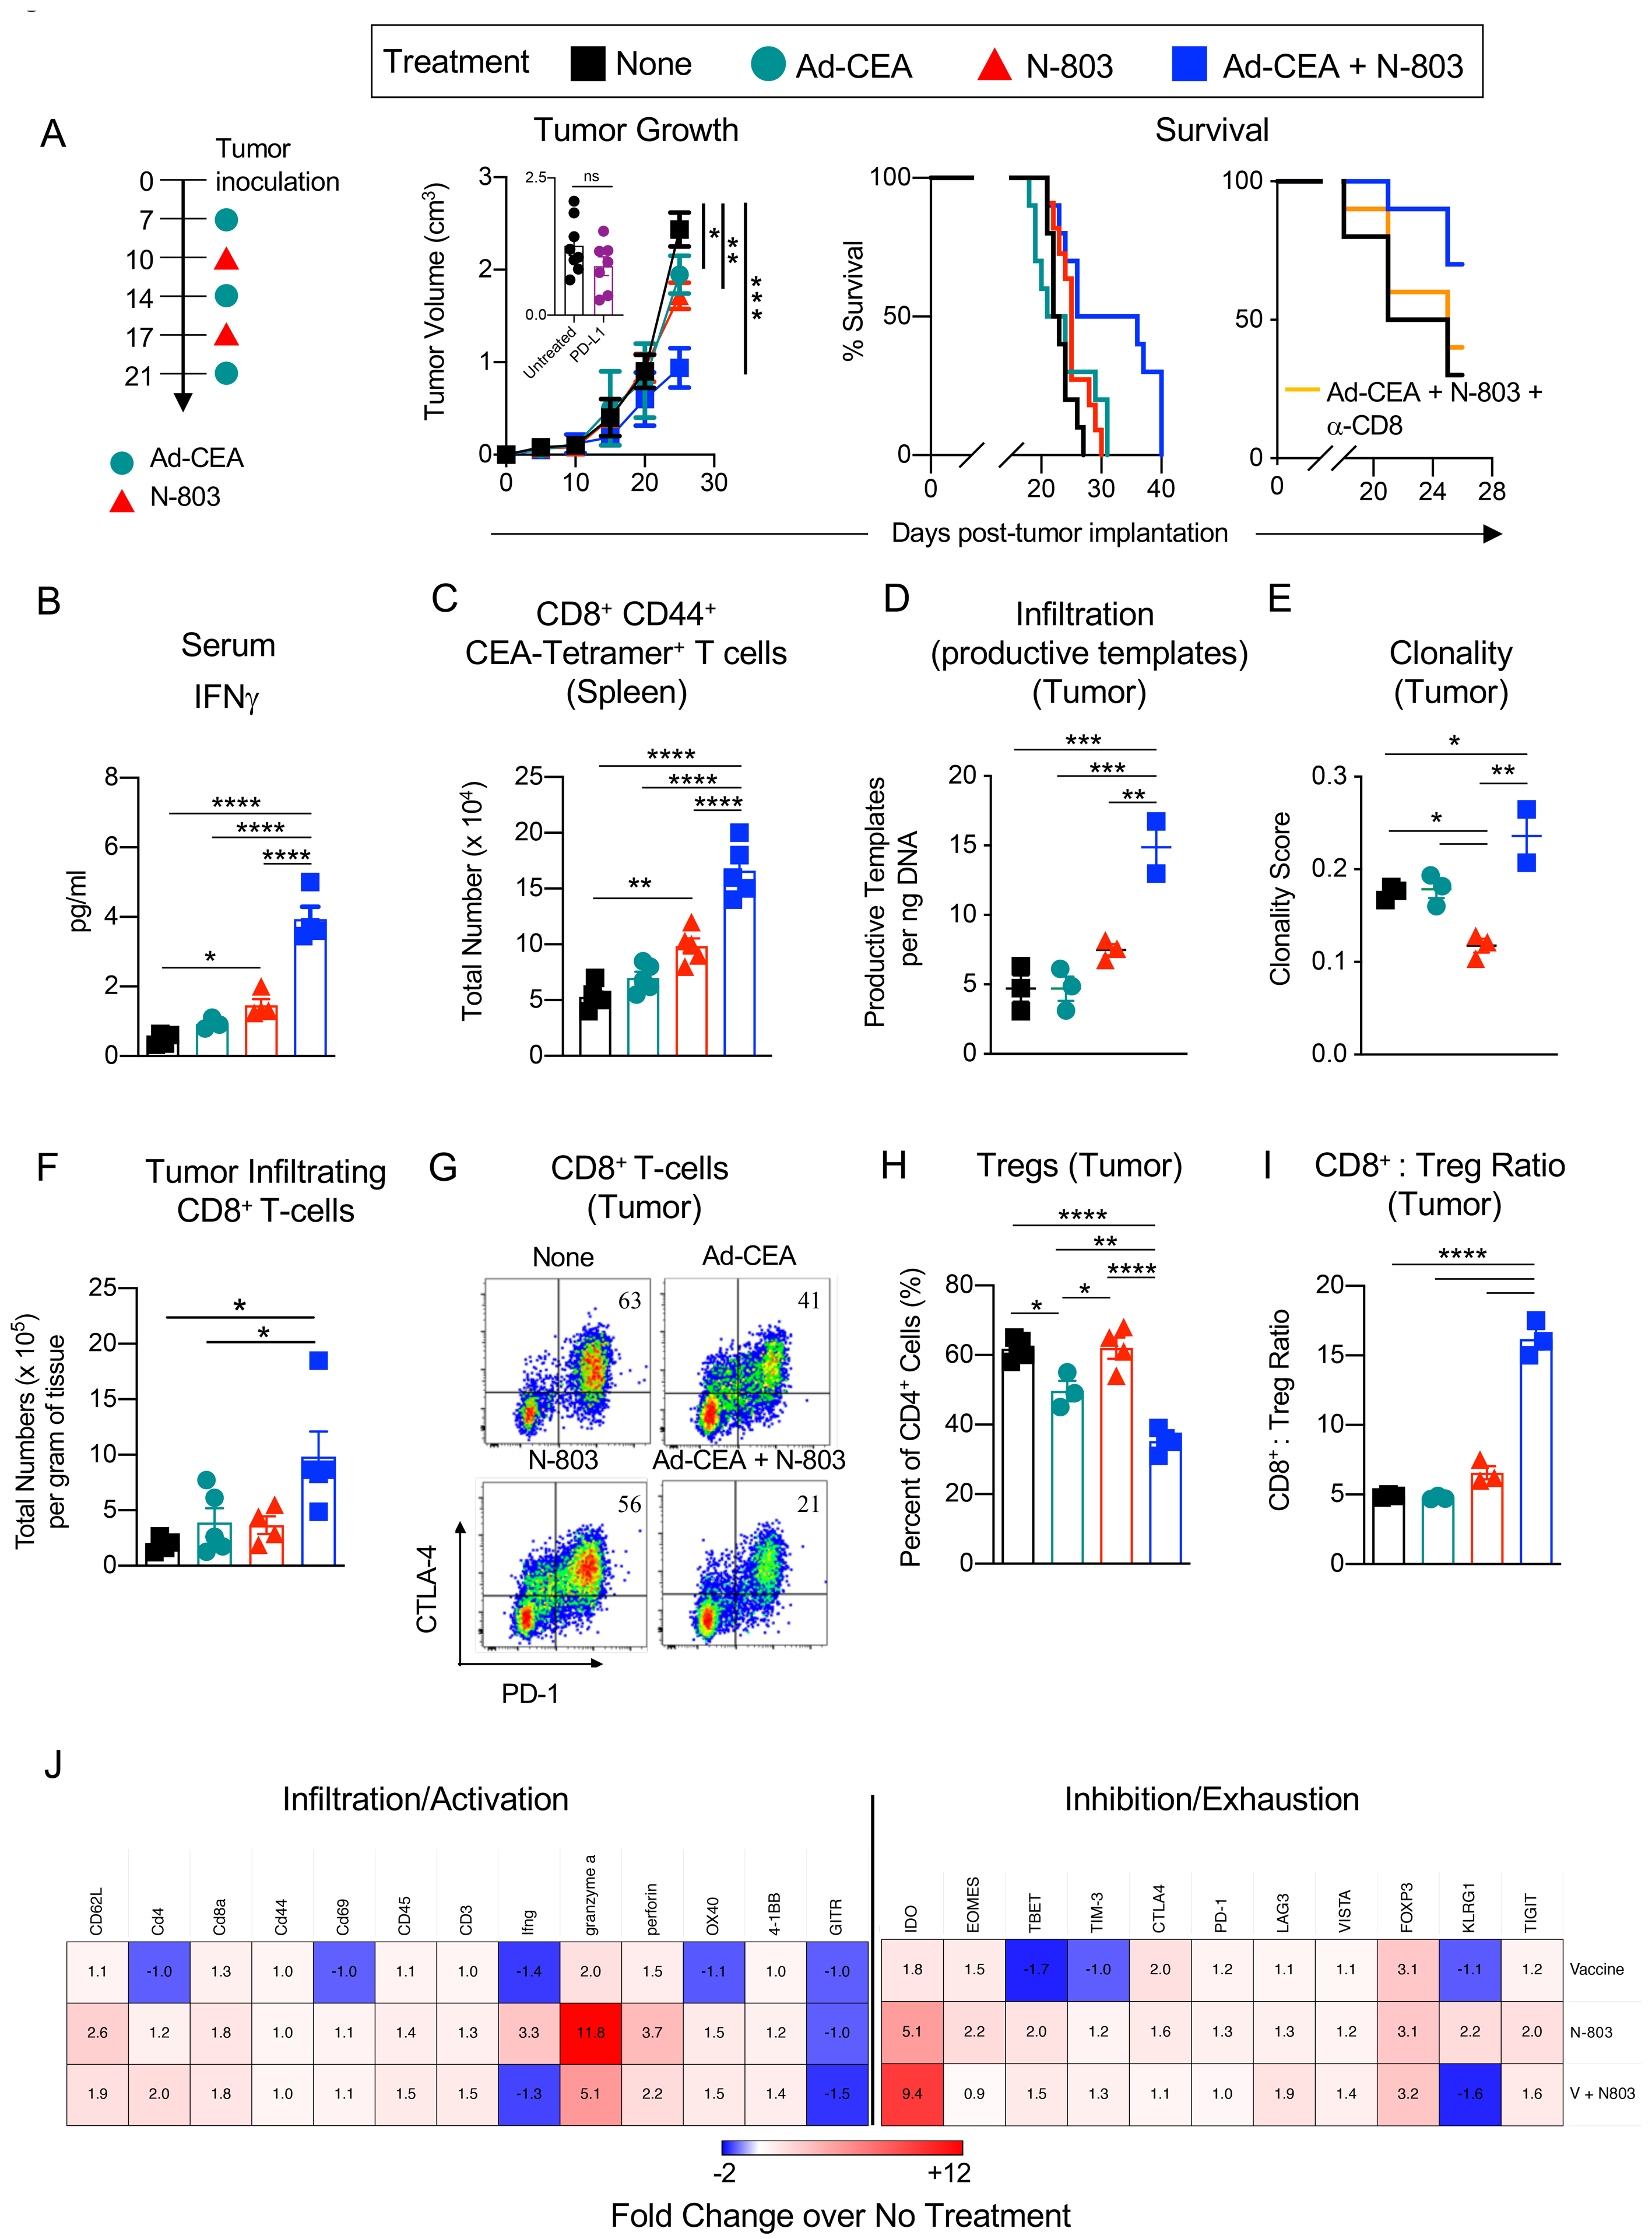
Figure 1. The combination of Ad-CEA and N-803 inhibits MC38-CEA tumor growth and promotes CD8+ T-cell responses.

Female C57BL/6-CEA-Tg mice (10–16 weeks old) were inoculated with MC38-CEA tumors. A. Treatment schema: injected tumor-bearing mice (n=10/group) with Ad-CEA (Vaccine, V) on days 7, 14, and 21 post-tumor implantation, with the IL15Rα superagonist N-803 on days 10 and 17, or each agent alone. Tumor growth and animal survival were monitored. Subsets of mice (n=7–8/group) were also treated with blocking anti-PD-L1 on days 14 and 21 post-tumor implantation, and tumor volumes were reported on day 25 post-tumor implantation (inset). The effect of CD8+ T-cell depletion on the survival of animals treated with the combination therapy was also monitored. On day 25 post-tumor inoculation, sera, spleens, and tumors were collected (n=3–5/group). B. Serum IFNγ quantified by ELISA. C. CEA-specific CD8+CD44+ splenocytes were identified via CEA tetramer staining. D-E. Genomic DNA was isolated from the tumors and were analyzed for (D) productive TCRβ rearrangement and (E) TCRβ clonality. F. Frequency of live tumor-infiltrating CD8+ T cells was determined by flow cytometry, and total CD8+ T cells per gram of tumor tissue was calculated. G. PD-1 and CTLA-4 expression on tumor-infiltrating CD8+ T cells was measured by flow cytometry. H. Tumor-infiltrating Tregs (CD4+CD25+FoxP3+) were quantified via flow cytometry. I. CD8+ T cell-to-Treg ratio in the tumor was determined. J. Immune-related transcriptome of the tumor samples was analyzed using the nCounter PanCancer Immune Profiling Panel. Heatmap showing select genes with data presented as fold change values on scale of −2 (blue) to +12 (red). One-way or two-way ANOVA with Tukey’s post hoc test for group analyses, t-test for comparison of two groups, and Kaplan-Meier survival analysis. *P<0.05; **P<0.01; ***P<0.005, ****P<0.001. Error bars represent mean±SEM. These studies were repeated 3–4 times with similar results.
