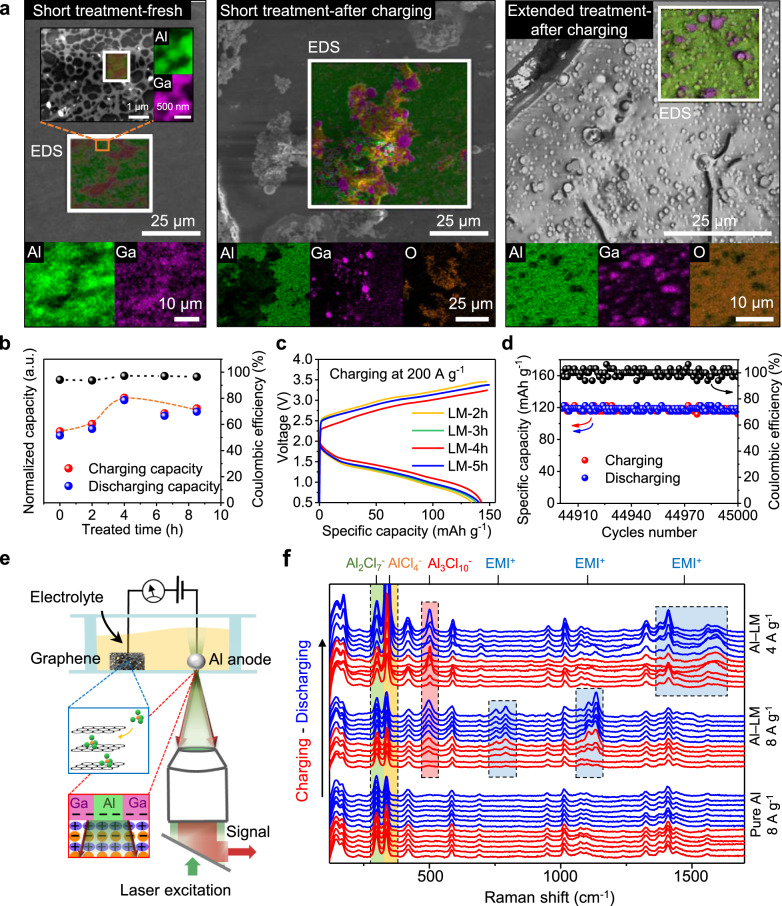
Fig. 3. Probing the role of the active anode.
a SEM images and elemental mapping (EDS) of gallium distribution on anode. Before charging, liquid metal forms a spread-out network on Al. After charging, part of the liquid metal wraps up as spheres next to those newly grown aluminum sites. b The effect of liquid metal treatment time on capacity (charging and discharging current density of 20 A g−1 and cut-off voltage of 2.45 V). c Galvanostatic charge and discharge curves. Graphene cathode has a mass of 0.026 mg and density of 0.16 mg cm−2. Note the optimal time (4 h) has the lowest saturation voltage and maximum capacity (ic = 200 A g−1). d Stability test of our Al-ion batteries using active anode over 45,000 cycles (same charging and discharging current density of 40 A g−1, cut-off voltage of 2.45 V). e Raman setup to study reaction on the active anode. f Time series of Raman spectra for one full cycle of charging and discharging at the interface of anode (ic = idc). Al2Cl7−, 299 cm−1 (green zone); AlCl4−, 338 cm−1 (yellow zone); Al3Cl10-, 500 cm−1 (red zone); and EMI+, 753, 790, 1135, 1410, 1590 cm−1 (blue zone).

