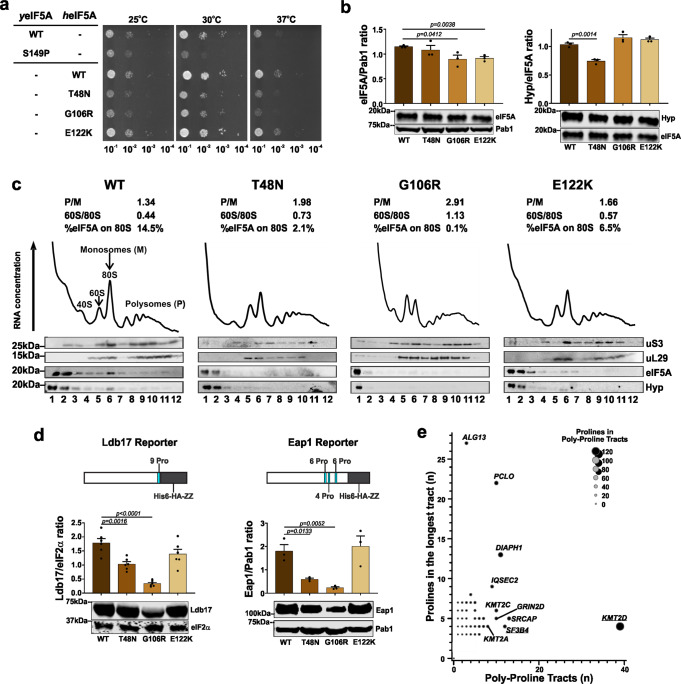
Fig. 2. EIF5A variants impair eIF5A function, its interaction with ribosome and synthesis of proteins with poly-proline tracts.
a Variants p.T48N and p.G106R affect yeast growth. Representative serial dilution growth assay of yeast strains for human eIF5A (heIF5A) and its variants, compared to the growth of strains with WT yeast eIF5A (yeIF5A) or the thermosensitive yeIF5A-S149P after 2 days. Eighteen replicates per temperature were performed. b Variant p.T48N reduces eIF5A hypusination, whereas p.G106R and p.E122K decrease eIF5A levels. eIF5A expression (left) and hypusination (Hyp; right) among yeast strains with missense heIF5A variants, grown at 30 °C in synthetic complete (SC) liquid medium. Each data point corresponds to one biological replicate, which was controlled as stated in the ‘Methods' (see Eq. (1)), and the bars show the mean + SEM. Two-sided P values were determined by unpaired t-test. Full uncropped images of gel blots are shown in Supplementary Fig. 9. c Missense mutants decrease eIF5A interaction with ribosome. Polysome profiles of yeast expressing either heIF5A-WT or missense variants, grown at 30 °C in SC medium. Corresponding western blot analyses of eIF5A, hypusine, and the ribosomal proteins uS3 and uL29 probed across gradient fractions for each polysome profile are presented beneath. Polysome-to-monosome (P/M) and 60/80S ratios for the A260 traces are given, calculated by comparing the areas under the 80S and polysome peaks. In addition, the fraction of total eIF5A signal associated with the 80S (western blot lane 6) is given. Full uncropped images of gel blots are shown in Supplementary Fig. 10. One profile was performed. d Missense mutants decrease synthesis of reporters with poly-proline tracts. Comparison of Ldb17 (left graph) and Eap1 (right graph) poly-proline-containing reporter expression in heIF5A yeast strains grown at 30 °C in SCGal medium. Data presentation and statistical treatment as described for panel b. Full uncropped images of gel blots are shown in Supplementary Fig. 11. e Genes with the highest numbers of prolines match the initial clinical suspicion for studied individuals. Enrichment of PPTs in MAGs. For each MAG the number of PPTs (X-axis) is plotted against the number of prolines in the longest PPT (Y-axis). MAG circle size represents the total number of prolines in PPTs in each protein. The ‘top 10’ ranked MAGs are named. Heterozygous loss-of-function variants in SF3B4 and KMT2D (both underlined) cause acrofacial dysostosis 1, Nager type (a subtype of mandibulofacial dysostosis, MIM #154400) and Kabuki syndrome 1 (MIM #147920), respectively, which overlap with the initial clinical suspicions in individual 1, and for individuals 2 to 4, respectively.

