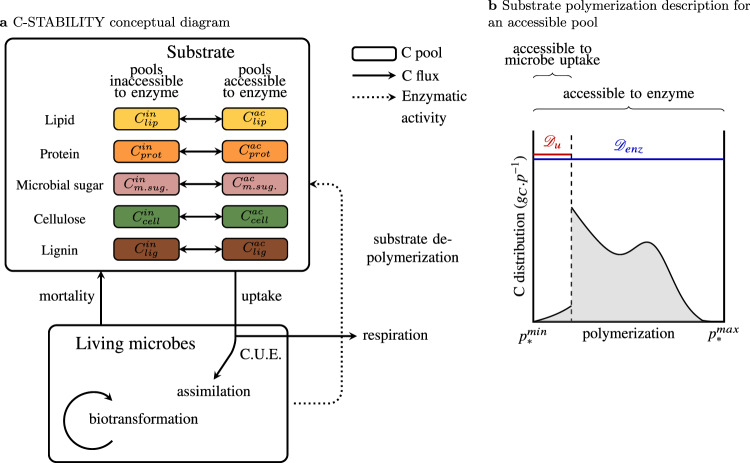
Fig. 1. C-STABILITY model framework.
a Conceptual diagram presenting interactions and exchanges between living microbes and organic substrate. Colored boxes stand for substrate C pools. The colors represent the different biochemical classes. The forms accessible to enzymes are separated from the inaccessible ones. Plain arrows represent C fluxes, the dotted arrow represents enzymatic activity. Microbial uptake is only possible for small oligomers, which are produced by enzymes. C.U.E. means carbon use efficiency. Assimilated C is biotransformed by microbes and returns to substrate through mortality. b Substrate polymerization (noted p) is described for each C pool. Polymerization is used to define how living microbes get access to substrate uptake. A continuous distribution reports the polymerization level of the C substrate of each biochemical class (denoted *). and are respectively the minimum and maximum levels of polymerization. The polymerization axis is oriented from the lowest polymerization level on the left to the highest polymerization level on the right. Here an accessible pool is presented. The same definition of polymerization stands for pool accessible and inaccessible to enzymes. The blue domain identifies polymers accessible to enzymes. The red domain identifies monomers and small oligomers accessible to microbe uptake. The amount of C corresponds to the area below the curve.

