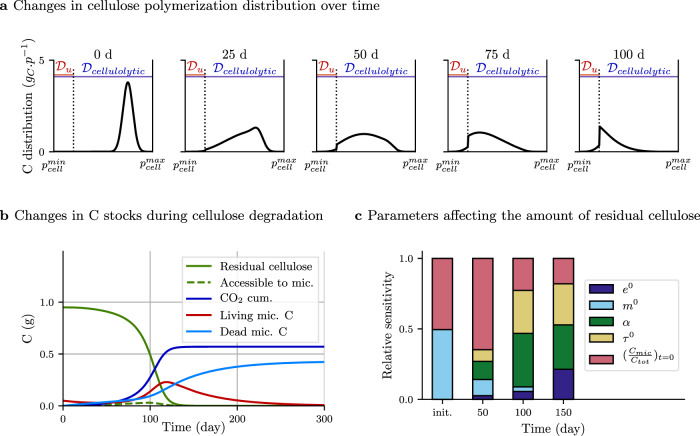
Fig. 3. Dynamics of cellulose degradation by one decomposer community (scenario 1).
a Changes in the distribution of cellulose polymer length over time, reported in gC. p−1 with p standing for the substrate polymerization. Cellulose is progressively depolymerized by enzymes. The domain (blue) is indicative of cellulose accessible to cellulolytic enzymes, the domain (red) is indicative of cellulose oligomers accessible to microbe uptake; and are the minimum and maximum levels of cellulose polymerization. The distribution shift toward over time illustrates the depolymerization of cellulose. Microbial uptake induces a substrate depletion in and causes a distribution discontinuity. b Amount of residual cellulose-C, C available for microbial uptake, cumulated CO2, living biomass-C, and dead microbial residues-C. There is no microbial recycling in this simulation. Note that the sum of cellulose-C and living microbes-C at the beginning is equal to the sum of cumulated CO2 and microbial residues-C at the end. c Sensitivity analysis on the amount of residual cellulose-C (±5% uniform variability of the parameters) at different times. Relative importance of model parameters changes over time depending on their role in the substrate degradation process. Tested parameters are the carbon use efficiency , mortality rate , substrate cleavage factor αenz, enzyme activity rate τ0, and initial microbial-C to total-C ratio. For instance αenz has no influence at the beginning while it explains more than 40% of the total model variance at 100 days.

