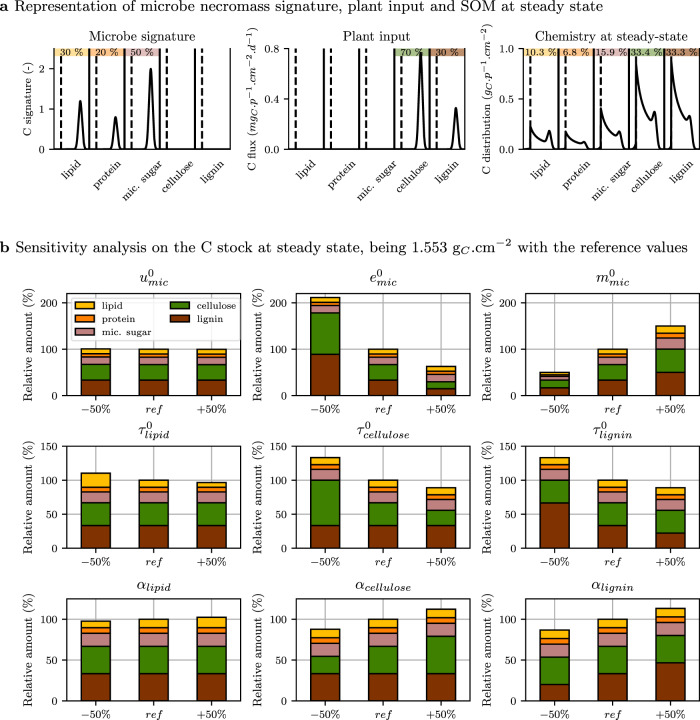
Fig. 6. Soil organic matter at steady state (scenario 4).
a Biochemistry and level of polymerization (noted p) of microbe necromass signature (left), plant material input flux (center), and the resulting soil organic matter at steady state (right) with reference parameter values given in Table 1. Different biochemical substrates are separated by vertical solid lines. They are all accessible to enzymes. Microbial uptake domains are positioned at the left of biochemical classes and are delimited by vertical dashed lines. This simulation leading to a C stock of 1.553 gC.cm−2 at steady state is considered as reference in the sensitivity analysis. b Sensitivity analysis showing the relative changes in total C stock and its distribution among biochemical classes with ±50% changes in the parameters (variations in uptake rate , carbon use efficiency , and mortality rate at row 1; variations in enzyme action rate and cleavage factor αenz illustrated for lipid depolymerases, cellulolytic and lignolytic enzymes at rows 2 and 3, respectively). For instance, a reduction of 50% of the value of leads to a decrease of 50% of the steady-state C stock in comparison to reference simulation. In this case, the biochemical relative composition remains stable. Note that the scale of the y-axis varies.

