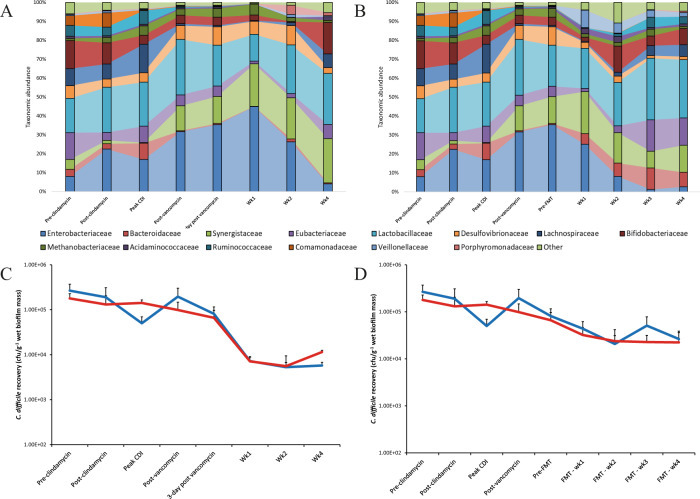
Fig. 2. Changes in the biofilm-associated microbiota during CDI and recurrence.
Percentage taxonomic abundance of bacterial families isolated from biofilm support structures taken from recurrence (rCDI) model (A) or the FMT model (B). Graphs constructed using mean (of least 3 support structures/time point) percent abundance of bacterial OTUs assigned to the family taxonomic level. Enumeration of biofilm-associated C. difficile (vegetative cells – red lines, spores – blue lines) from support structures from the recurrence (C) and FMT models (D). Results shown as mean log10 cfu/g wet biofilm mass from two biological replicates and at least four support structures. Error bars represent the standard deviation.

