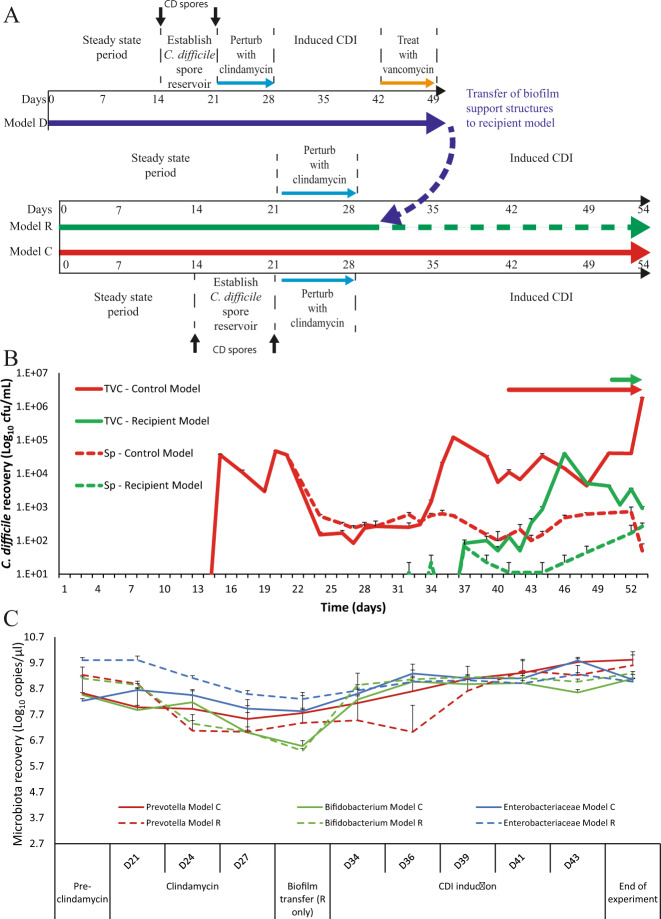
Fig. 3. Contribution of biofilm-associated C. difficile to cause recurrent disease.
A Timeline of events from the biofilm donor model (Model D, blue arrow) prior to support structure transfer, and two further models; a control model (Model C, red arrow) inoculated with C. difficile spores, and a biofilm recipient model (Model R, green arrow), which did not receive spores, but received the biofilm support structures from model D (broken blue arrow). B Recoveries of luminal C. difficile (total viable counts – TVC; spores - Sp) from model C (red line) and model R (green line) and subsequent periods of toxin detection (arrows). Solid lines are C. difficile total viable cells and broken lines are spore recoveries. Results expressed as mean log10 cfu/mL from two biological replicates. C Quantitative PCR enumeration of selected luminal microbiota populations from model C (whole lines) and model R (dotted lines) immediately prior to clindamycin instillation (pre-clindamycin), during clindamycin therapy and throughout CDI development and progression. Results expressed as mean log10 copy number per µL of luminal fluid from two biological replicates. All error bars represent the standard deviation.

