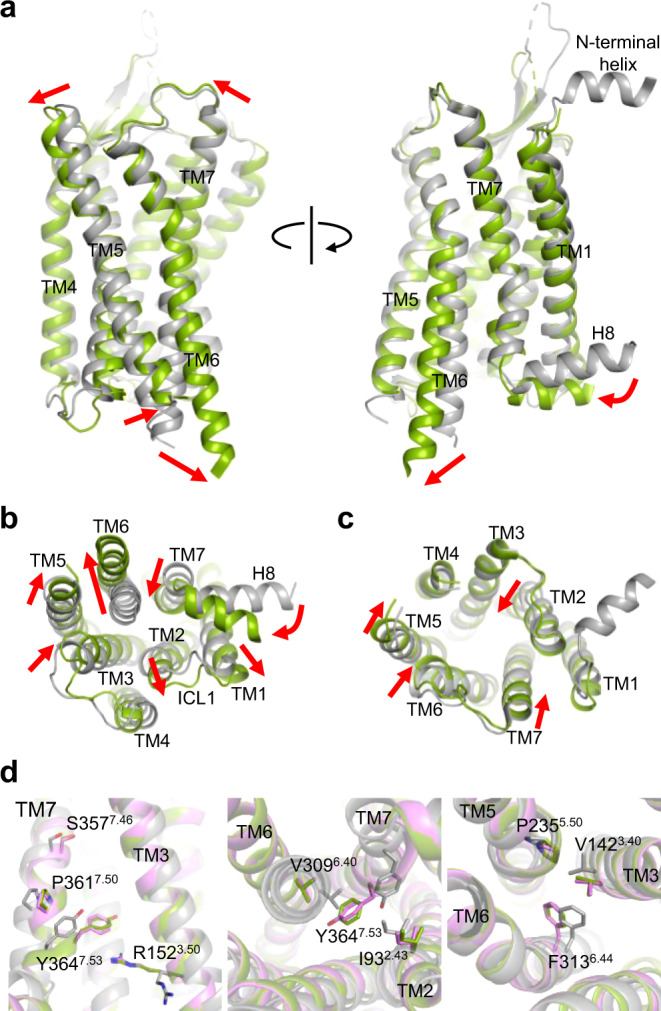
Fig. 2. Comparison of inactive-state and active-state OX2R.

a Superposition of OxB-activated (green) and inactive-state OX2R (gray; PDB ID 5WQC) viewed from two different angles from within the membrane. Red arrows indicate conformational transitions upon OX2R activation. b, c Intracellular and extracellular view of the superimposed receptor structures, respectively. Residues 192–214 of ECL2 have been removed for clarity. d Arrangement of conserved motifs associated with receptor activation: DRY (left), NPxxY (middle), and hydrophobic core triad (right). Structures with OxB (green) and compound 1 (purple) are overlaid with inactive-state OX2R (gray).
