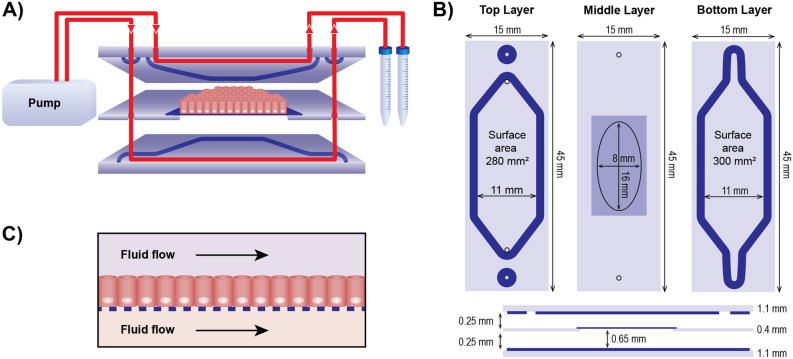
Figure 1.
Schematic illustration of the experimental setup of the gut-on-chip (A) Schematic design of the microfluidic system showing a vertical cross-section of the glass chip. The red lines represent the flows in and out of both compartments. (B) Schematic drawing of the three glass layers that form the chip, the oval in the middle layer represents a cut-out in the glass and the darker square represents the porous membrane covering the cut-out. The dark blue lines in (A) and (B) represent the gaskets that form the boundaries of the compartments when the three glass layers are pressed together in the chip holder. (C) Schematic drawing showing how cells were exposed to fluid flow.

