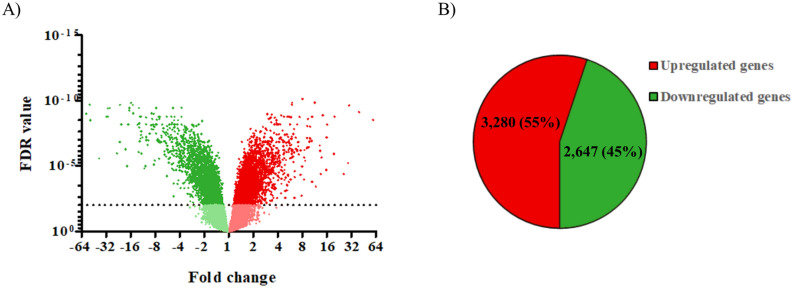
Figure 3.
Overview of the differential gene expression in Caco-2 cells grown in a gut-on-chip device versus Transwell inserts after 21 days of culture. (A) Volcano plot of all differentially expressed genes where the FDR value of each gene is plotted against the fold change in expression; the dotted line indicates an FDR of 0.01. (B) The number and percentages of differentially expressed genes in Caco-2 cells grown in a gut-on-chip device compared to cells grown in Transwell inserts.

