
Fig. 2. Comparison of the perivascular space burden between PD and HC groups.
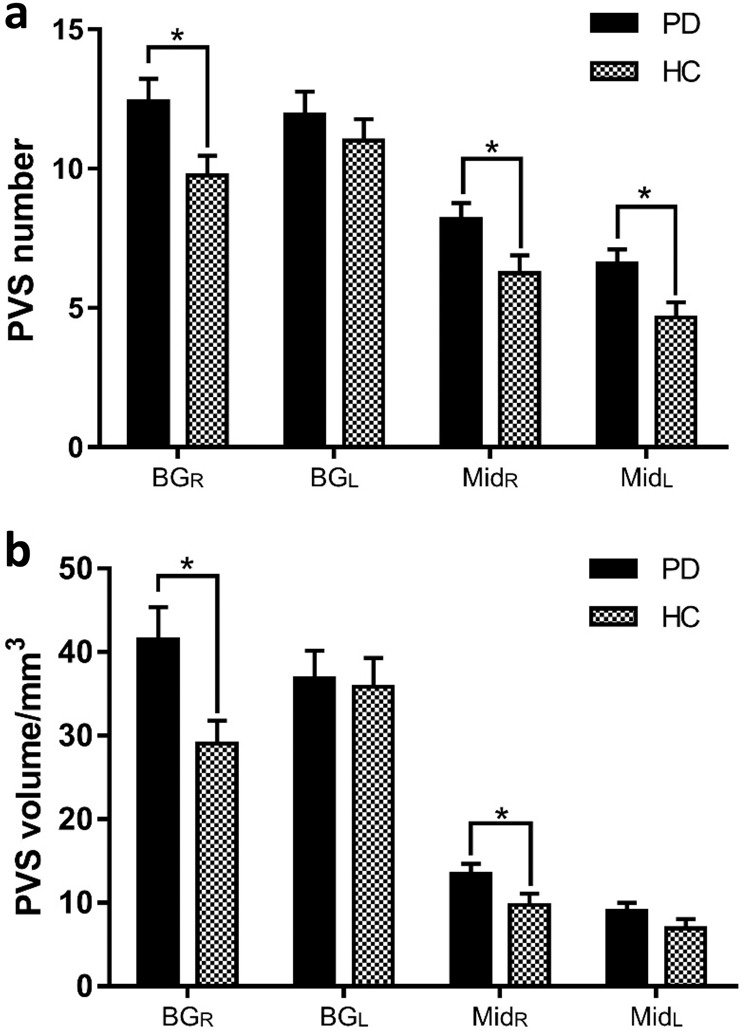
a PVS number and b PVS volume in BG and midbrain (Mid). *Indicates p < 0.05. The results are presented as means ± standard error of mean.
Official websites use .gov
A
.gov website belongs to an official
government organization in the United States.
Secure .gov websites use HTTPS
A lock (
) or https:// means you've safely
connected to the .gov website. Share sensitive
information only on official, secure websites.
a PVS number and b PVS volume in BG and midbrain (Mid). *Indicates p < 0.05. The results are presented as means ± standard error of mean.