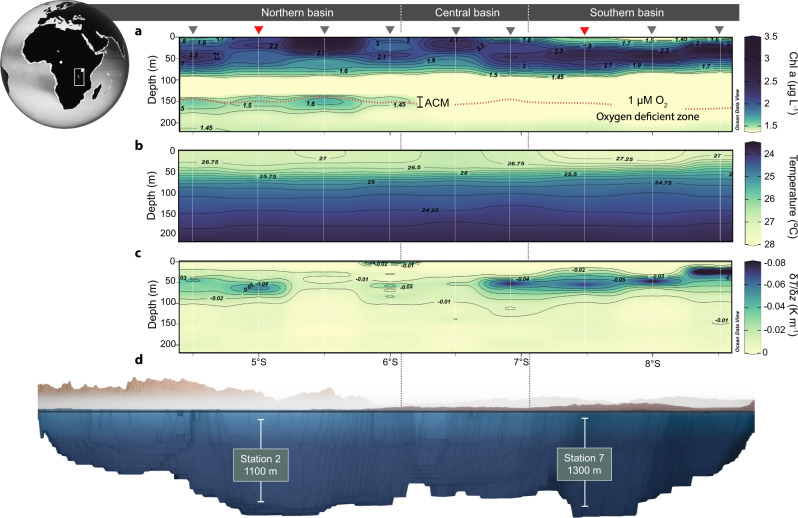
Fig. 1. Distribution of the anoxic chlorophyll maximum (ACM) in the oxygen-deficient zone of Lake Tanganyika.
Data shown are from the April–May 2018 campaign, while a return expedition was made in April–May 2019 to better resolve the vertical structure and nitrogen transformation processes in the ACM, shown in Figs. 2 and 3. a In situ chlorophyll a fluorescence. The oxygen-deficient zone is delimited at an O2 cutoff of 1 μM indicated by the dotted line. The main sampling stations 2 and 7 are marked by red triangles, while additional sampling stations are indicated by black triangles. b Temperature distribution. c Vertical temperature gradient. d Bathymetry of Lake Tanganyika and the sill that separates the North, Central, and South basins, based on the bathymetry map by Cohen et al.57. The lake water column is denoted in blue, while the surrounding mountain terrain is indicated in brown.

