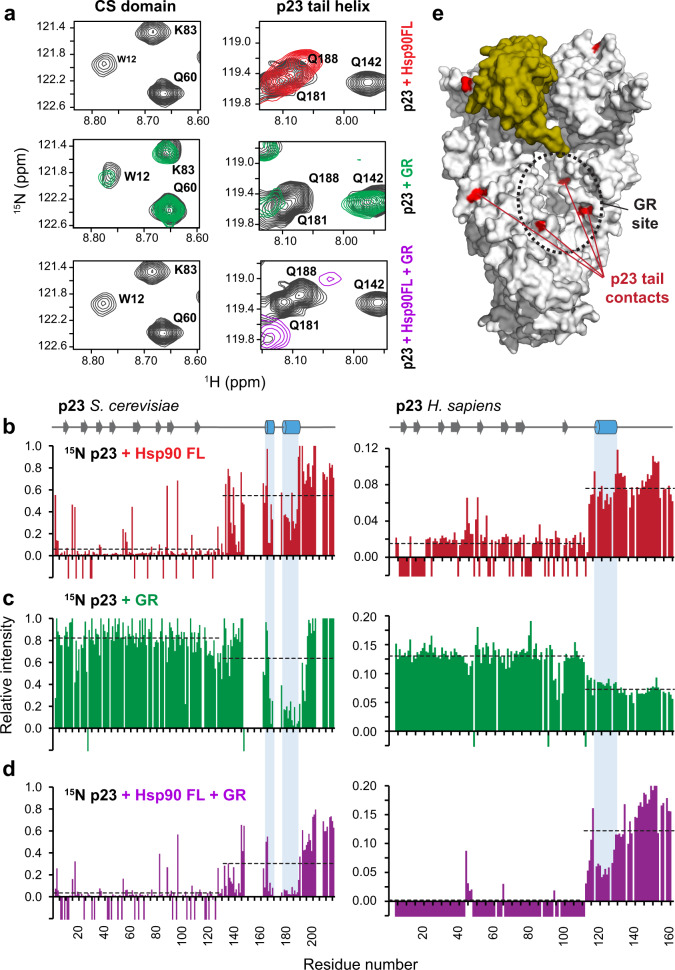
Fig. 5. NMR analysis of 15N-labeled p23 in the presence of Hsp90/AMP–PNP, and/or GR.
a Zoomed view of 1H-15N HSQC NMR signals in the CS domain and the helical motif in the p23 tail comparing p23 free in solution (black), in the presence of Hsp90 FL (red), GR-LBDm (green) or Hsp90 FL and GR-LBDm (purple). Intensity ratios of p23 peaks in the absence and in the presence of (b) full-length Hsp90 (FL), (c) the GR ligand binding domain (GR-LBDm), or (d) Hsp90 FL and GR-LBDm, for yeast (left) and human (right). Negative bars indicate resonances broadened beyond detection; the average peak intensity for the p23 core domain and the C-terminal tail is shown as a dashed line. Secondary structure elements are shown at the top, highlighting the helical motifs in the p23 tail. e Binding sites of the p23 tail and GR interactions with the Hsp90 dimer overlap at the MC interface.

