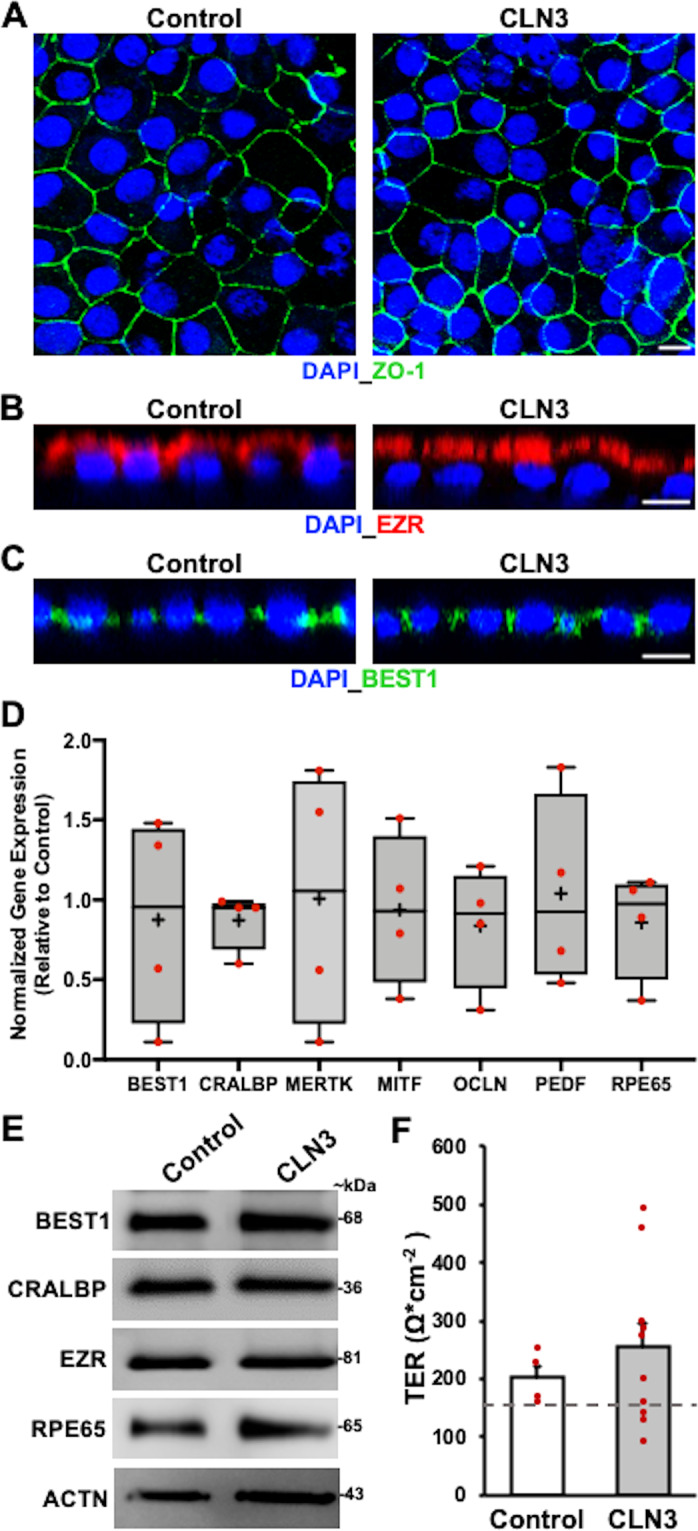
Fig. 1. Baseline RPE characteristics are similar in control and CLN3 disease hiPSC-RPE cells.

A–C Representative confocal microscopy images showing similar and expected localization of tight junction marker, Zonula Occludens-1 (ZO-1) (A), apically localized RPE protein, Ezrin (EZR) (B), and basolaterally expressed RPE protein, Bestrophin-1 (BEST1) (C), in control and CLN3 disease hiPSC-RPE cells. Of note, cell nuclei are stained with DAPI (Scale bar = 10 µm) (n ≥ 3). D Quantitative real-time PCR analyses showing similar expression of RPE-signature genes in CLN3 disease hiPSC-RPE cells relative to control hiPSC-RPE cells: BEST1 (p = 0.76), Cellular Retinaldehyde-Binding Protein (CRALBP; p = 0.30), MER proto-oncogene (MERTK; p = 0.98), Microphthalmia-associated Transcription Factor (MITF; p = 0.83), Occludin (OCLN; p = 0.50), Pigment Epithelium-Derived Factor (PEDF; p = 0.91), Retinoid Isomerohydrolase RPE65 (p = 0.51). GAPDH served as loading control. (Control: n = 3, CLN3: n = 4). Of note, in the boxplots, + represents mean, center line represents median, box represents interquartile range between first and third quartiles, and whiskers represent 1.5* interquartile range. E Representative Western blot images showing similar expression of RPE-signature proteins (n = 3): BEST1 (68 kDa), CRALBP (36 kDa), EZR (81 kDa), RPE65 (65 kDa), and Actin (ACTN, 43 kDa). F Transepithelial resistance (TER) measurements showing the presence of functional tight junctions with TER similar to the reported in vivo threshold of ~150 Ω cm−242,43 (dotted line) in both control and CLN3 disease hiPSC-RPE cells grown as a monolayer on Transwell inserts (Control: n = 4, CLN3: n = 10; p = 0.27). For all graphs in Fig. 1, statistical significance was determined using two-tailed unpaired Student’s t-test.
