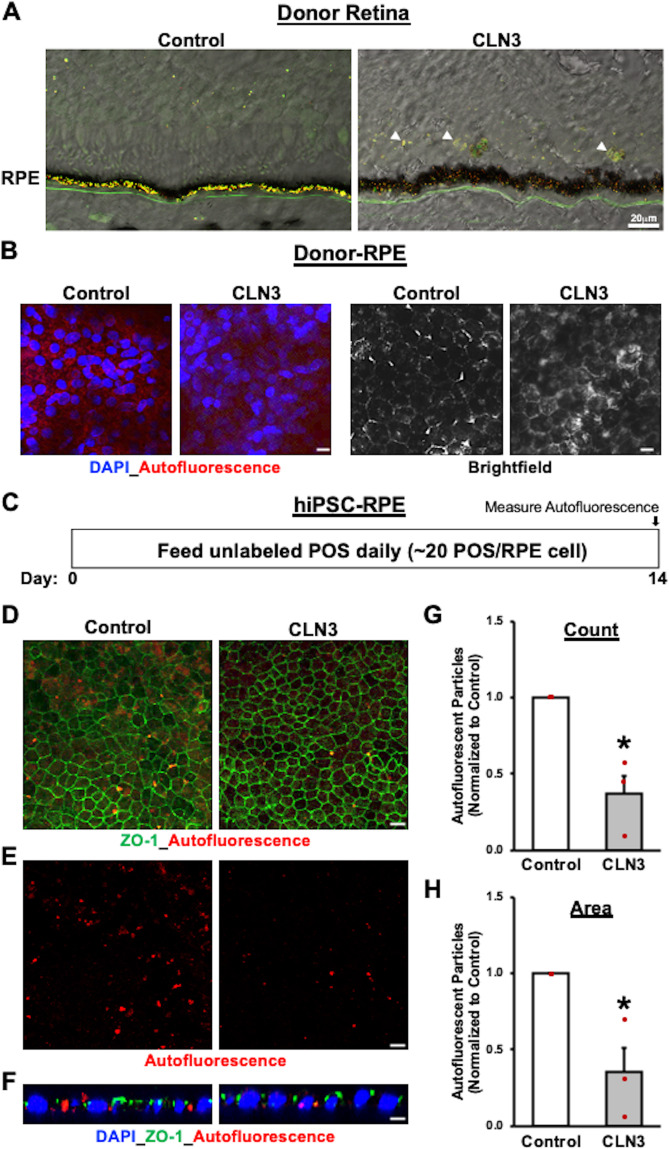
Fig. 2. Decreased accumulation of autofluorescent material after chronic POS-feeding in CLN3 disease hiPSC-RPE cells mimics reduced presence of autofluorescent POS-digestion products in CLN3 disease donor RPE monolayer.
A Autofluorescence overlying brightfield images in cryosections of mid-periphery fragments of retina-RPE-choroids obtained from a CLN3 disease donor and age-matched control eye showed decreased accumulation of autofluorescent material in the RPE layer of CLN3 disease donor eyes in spectral wavelength consistent with lipofuscin (red and green channels). Additionally, increased accumulation of autofluorescent debris is seen in the photoreceptor layer (indicated by white arrowheads) in the CLN3 disease donor retina compared to control retina. (Scale bar = 20 µm) (n = 1). B Confocal microscopy analyses of RPE wholemounts obtained from the same CLN3 disease and control donor eyes (as were shown in panel A) showed decreased autofluorescence (measured in red channel) in areas with intact RPE monolayer. Of note, light microscopy images (right panel) are from the same area of view as autofluorescence images (left panel) (scale bar = 10 µm) (n = 1). Furthermore, to use age-matched control, control cadaver RPE used in panels A, B was from a donor with Charcot Marie Tooth Disease. C Schematic showing the experimental design used to assess autofluorescence material accumulation in hiPSC-RPE cells with chronic POS-feeding. As shown, hiPSC-RPE were fed a physiological dose of unlabeled POS (~20 POS/RPE cell) daily for 14 days. Subsequently, the cells were fixed, immunostained and imaged for autofluorescent material accumulation (red channel) using confocal microscopy. D–F Consistent with CLN3 disease donor RPE data (A, B), confocal microscopy analyses after 2 weeks of daily POS feeding showed decreased autofluorescent material (ex: 546 nm, em: 560–615 nm) in CLN3 disease hiPSC-RPE monolayer compared to control hiPSC-RPE monolayer. In contrast, similar localization of tight junction protein (ZO-1) was seen in both control and CLN3 hiPSC-RPE monolayers. Of note, panel (E) shows the same image region of control and CLN3 disease hiPSC-RPE as panel D but displays autofluorescence material accumulation without ZO-1 staining (scale bar = 10 µm) (n = 3). F Representative orthogonal view of confocal z-stack images showing that autofluorescent material localizes basal to the tight junction marker, ZO-1, and is within the control and CLN3 disease hiPSC-RPE cells. Cell nuclei is stained with DAPI (scale bar = 10 µm) (n = 3). G, H Quantitative analyses showing both decreased count (G, p = 0.011) and area (H, p = 0.026) of accumulated autofluorescent material (ex: 546 nm, em: 560–615 nm) after 14 days of consecutive POS feeding in parallel cultures of control versus CLN3 disease hiPSC-RPE cells (n = 3). Statistical significance was determined using two-tailed unpaired Student’s t-test. *p < 0.05.

