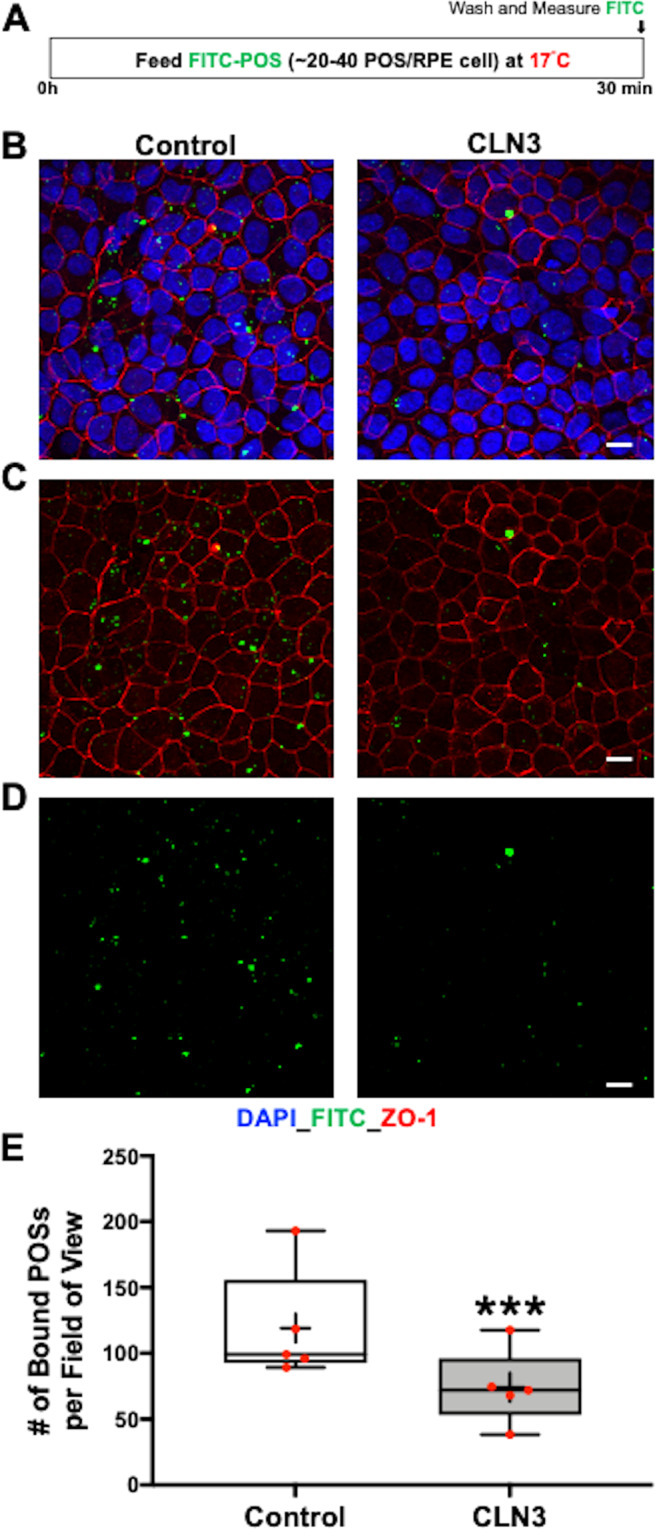
Fig. 5. CLN3 disease hiPSC-RPE display a POS-binding defect.

A Schematic showing the protocol used to evaluate POS binding by hiPSC cells. Specifically, hiPSC-RPE cells were fed FITC-POS (~20–40 POS/RPE cell) at 17 °C for 30 min, a temperature favorable to POS binding but not POS internalization47. Subsequently, POS-fed hiPSC-RPE cells were washed with 1X PBS to remove any POS remaining on the hiPSC-RPE cell surface. Next, the hiPSC-RPE cells were fixed, immunostained with ZO-1 (red channel) and DAPI (blue channel) and the amount of POS phagocytosed by hiPSC-RPE cells was determined by measuring FITC-fluorescence (green channel) using confocal microscopy. B–D Representative confocal microscopy images showing DAPI (B) ZO-1 (B, C), and FITC fluorescence (B–D) in parallel cultures of control versus CLN3 disease hiPSC-RPE cultures. Notably, reduced amount of FITC-fluorescence (bound-POS) post 30 min FITC-POS feeding at 17 °C is seen in CLN3 disease hiPSC-RPE cells compared to control hiPSC-RPE cells (scale bar = 10 µm) (n = 5). E Quantitative analyses showed reduced number of bound FITC-POS particles (particles < 5 µm, threshold set to exclude POS aggregates) in CLN3 disease hiPSC-RPE cells compared to control cells (n = 5, p = 0.00006, two-tailed unpaired Student’s t-test). For the boxplot, + represents mean, center line represents median, box represents interquartile range between first and third quartiles, whiskers represent 1.5* interquartile range, and dots represent outliers. ***p < 0.0005.
