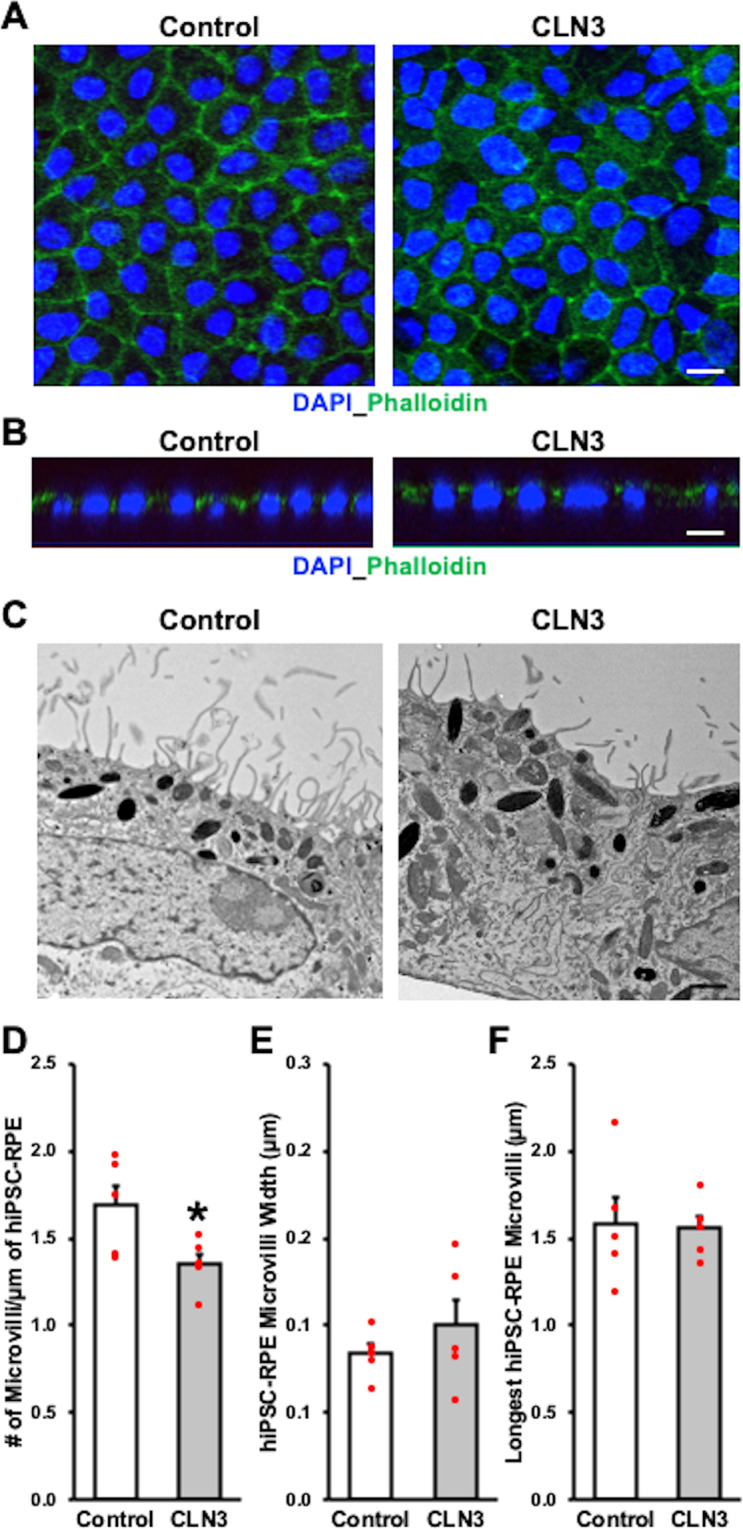
Fig. 6. Decreased apical RPE microvilli density in CLN3 disease hiPSC-RPE cultures.

A, B Representative confocal microscopy images after immunocytochemical analyses showing similar localization of F-actin as visualized by phalloidin staining in control and CLN3 disease hiPSC-RPE cells (scale bar = 10 µm) (n = 3). Of note in panel B, orthogonal view of hiPSC-RPE monolayer shows expected apical localization of phalloidin relative to cell nuclei (DAPI) in control and CLN3 disease hiPSC-RPE. C–F Representative transmission electron microscopy (TEM) images (C, scale bar = 1 µm) and corresponding quantitative analyses showing decreased apical RPE microvilli density (D, p = 0.042), but similar apical-RPE microvilli width (E, p = 0.38), and length (F, p = 0.88) in control versus CLN3 disease hiPSC-RPE cells (n = 5). Two-tailed unpaired Student’s t-test performed for all statistical analysis. *p < 0.05.
